Engineering · 2024
Desktop Tool for SEM Image AI Training and Inspection
A Windows app that handles layout-driven SEM image generation and SEM anomaly screening in one window
A desktop application that lets semiconductor SEM imaging models be prepared, trained and run without touching the command line. Data straight from the measurement tool can be opened and labelled, training settings edited, and inference results reviewed alongside the images, all in a single window.
- Client
- Confidential client
- Category
- Engineering
Overview
This is a Windows desktop application for operating semiconductor SEM (scanning electron microscope) image models without having to work with the model code directly. Selecting and preparing training data, launching training runs, and reviewing inference results next to the images all happen in one window.
The app has two modules. GDS to SEM drives a model that generates SEM images from chip layout images, and Image Warning drives a model that decides whether a SEM image is normal or anomalous. Both modules carry inference, data preparation and training tabs; Image Warning adds a data explorer.
The model code itself is developed separately by the research team. The app does not embed any of it. It runs external Python scripts through an agreed command-line contract, then reads their standard output and output files to populate the screen.
Challenge
Keeping the UI independent of the models
Model code keeps changing as research progresses. If the app imported the model libraries directly, every change in the model's dependencies would pull the app along with it. The UI needed a way to stay unaffected.
Measurement data arrives in more than one folder shape
The MSR files and image folders produced by the tool come in three arrangements: the MSR file beside the image folder, the MSR file inside the image folder, and images split one level further into subfolders named after the measurement point number (pno). Any of the three had to open in the same screen.
Comparing two images in different coordinate systems
A GDS layout is a design drawing and a SEM image is a photograph, so their scale and position do not line up. Building a training pair means someone has to match them by eye and crop the same region from both.
Smooth interaction on large images
SEM and layout images run to thousands of pixels on a side. If panning and zooming stutter, the alignment work is simply not possible.
Solution
GDS to SEM
- Inference — load a layout image, mark a region with the crop box, preview Canny edges, grayscale and horizontal or vertical flips on the crop, then hand it to the generation model. The generated image appears in the lower pane and can be saved to file
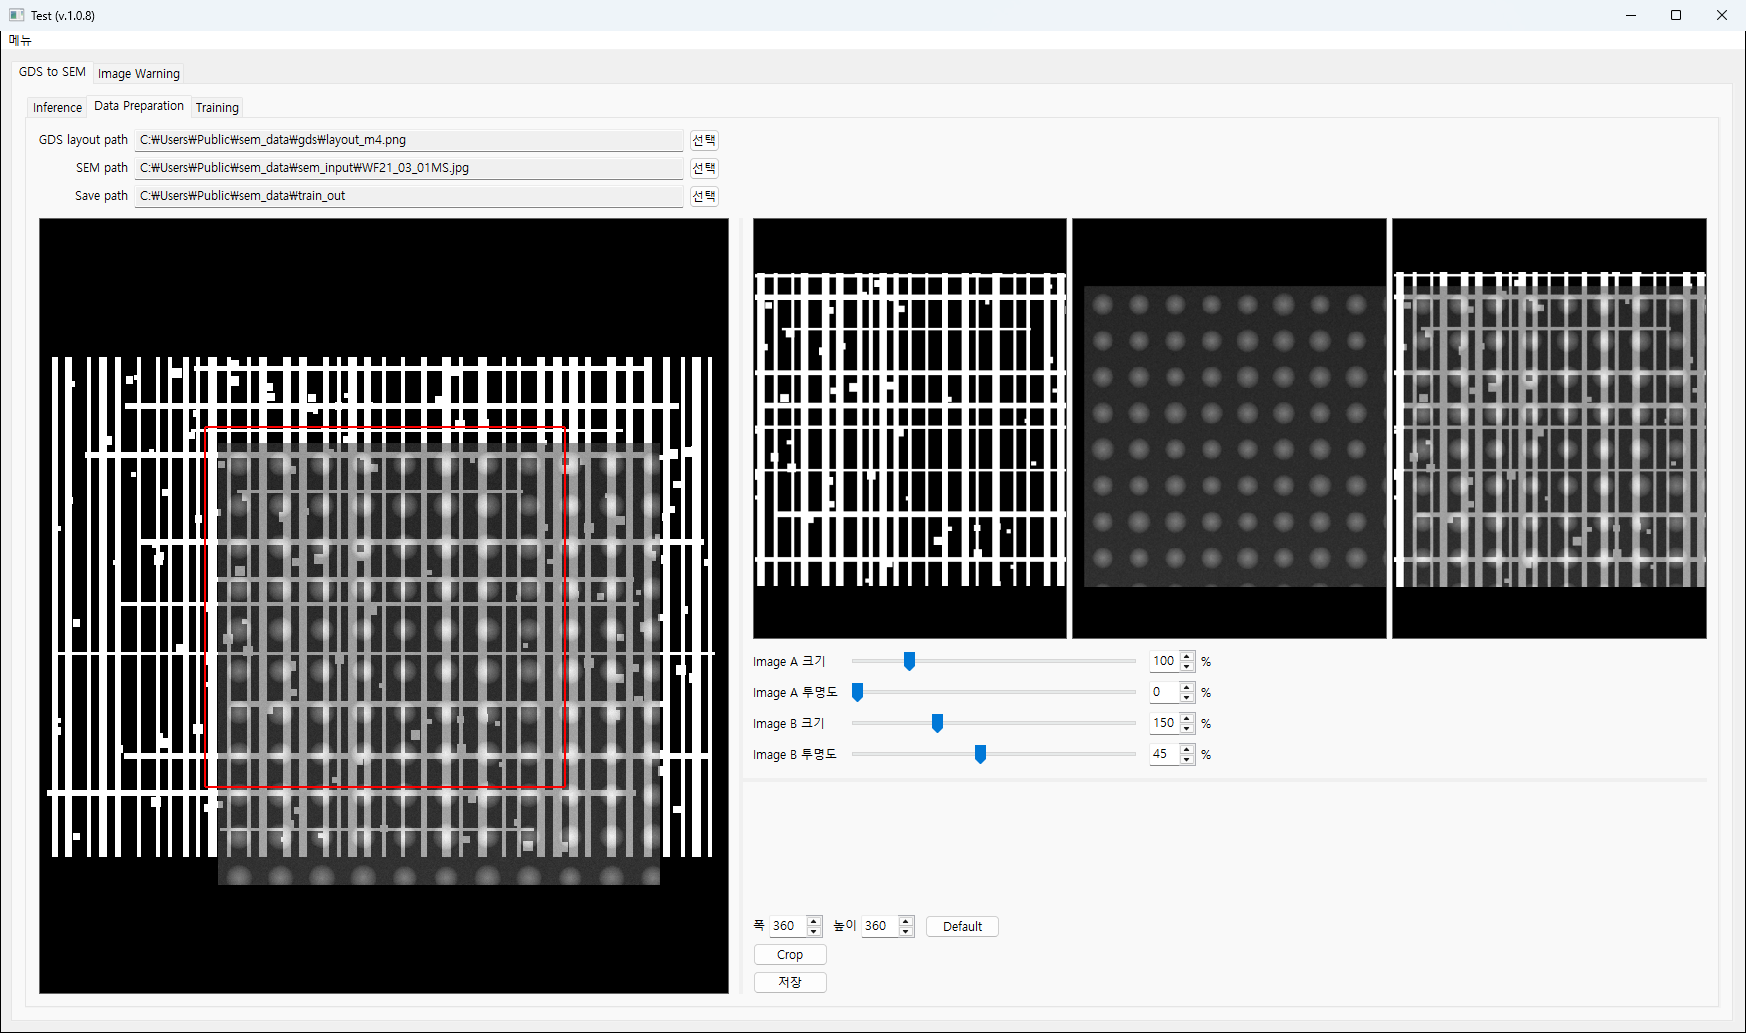
- Data Preparation — place the layout and the SEM image on one canvas, adjust the scale and opacity of each until they match, then crop layout, SEM and composite in one action and save all three
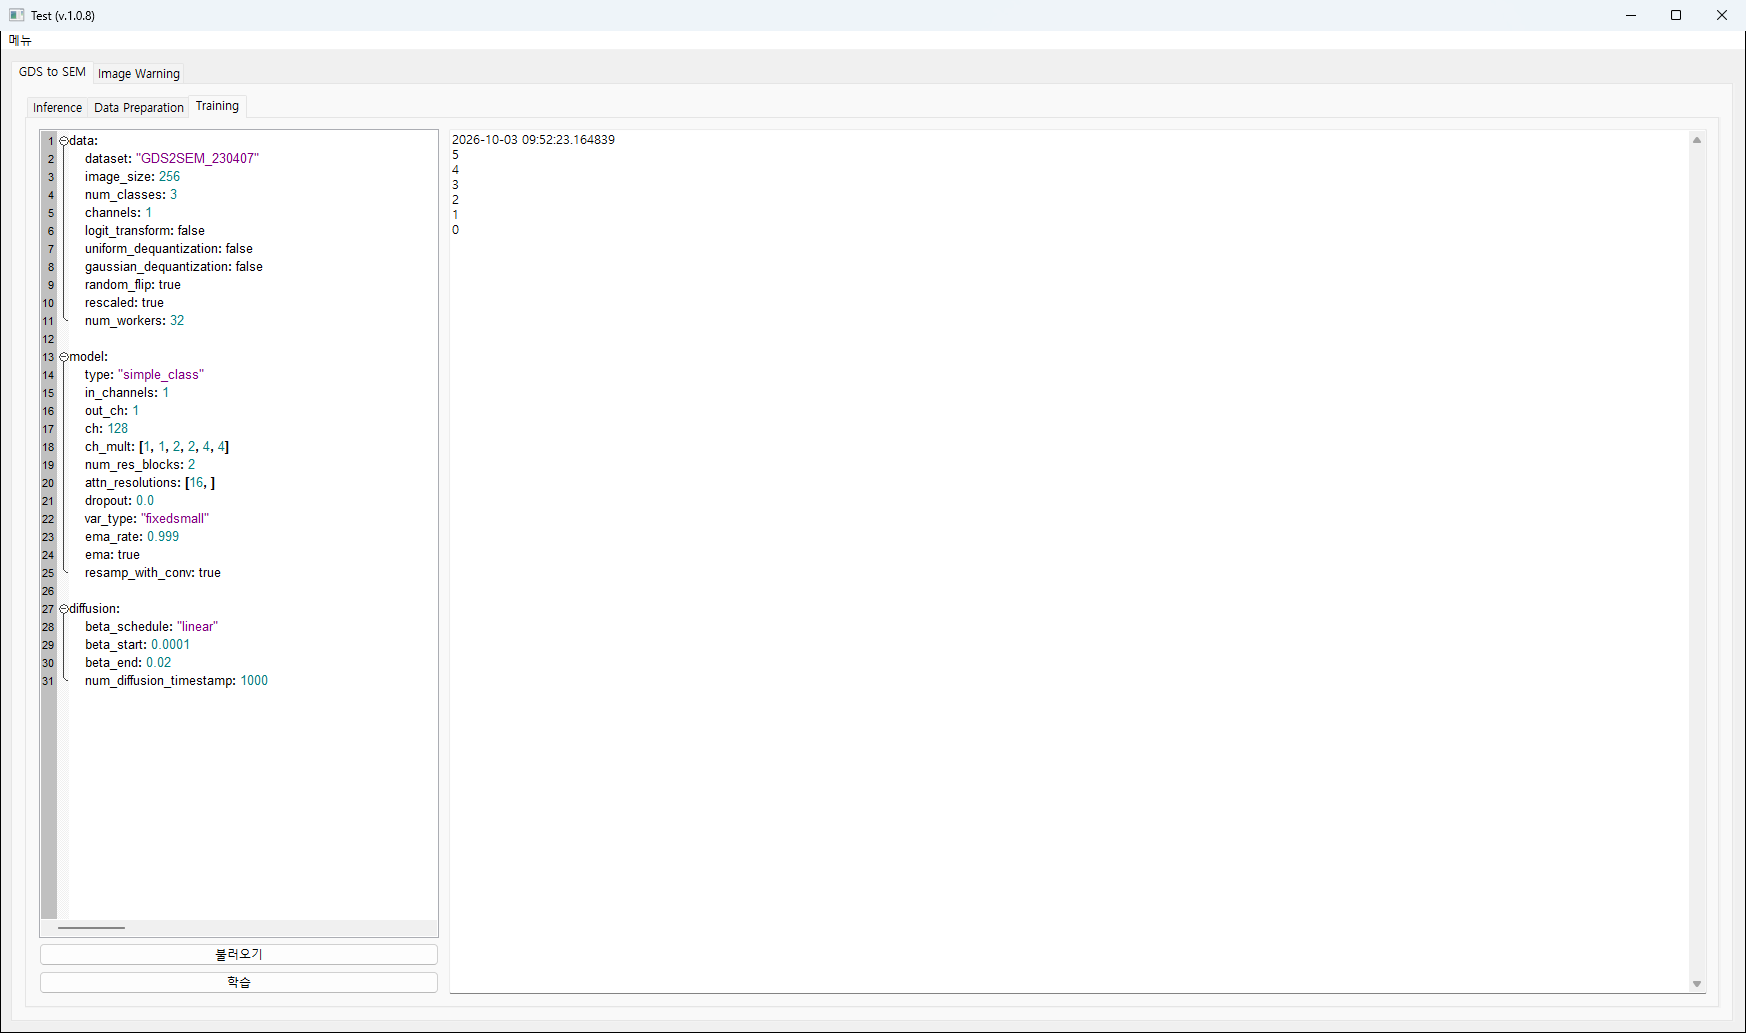
- Training — edit the training configuration in a YAML editor and watch the training script's output stream into the pane beside it
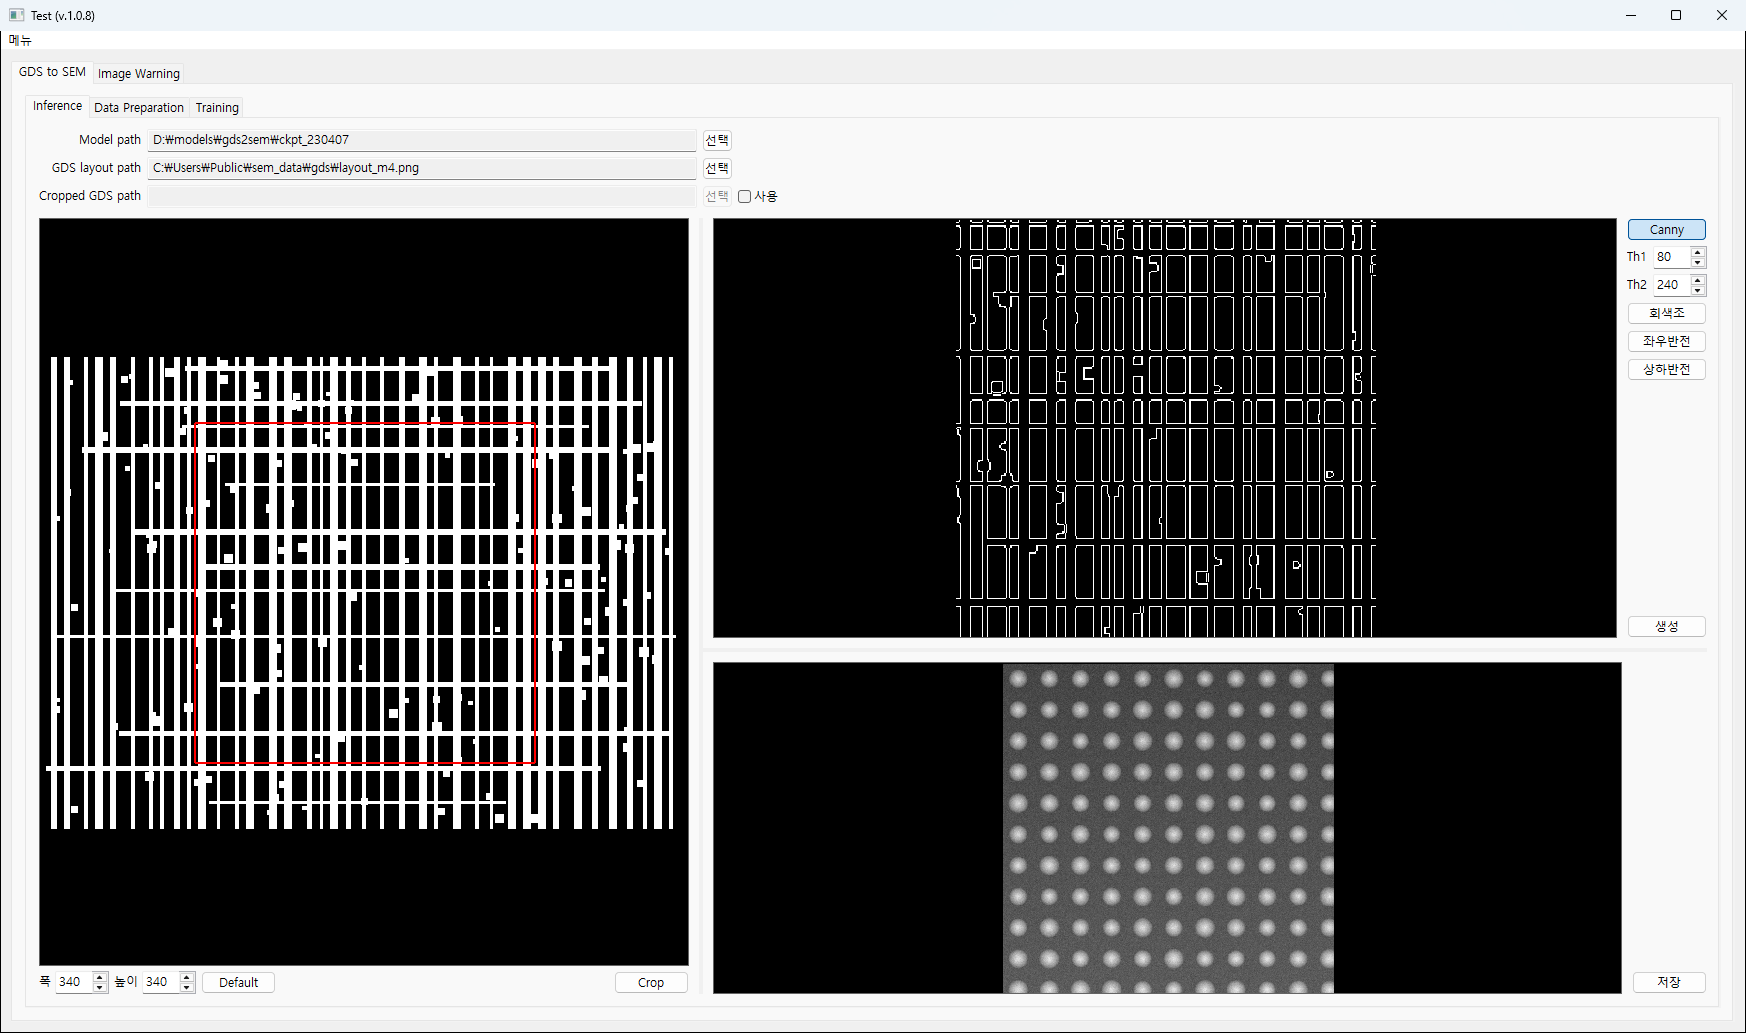
Image Warning
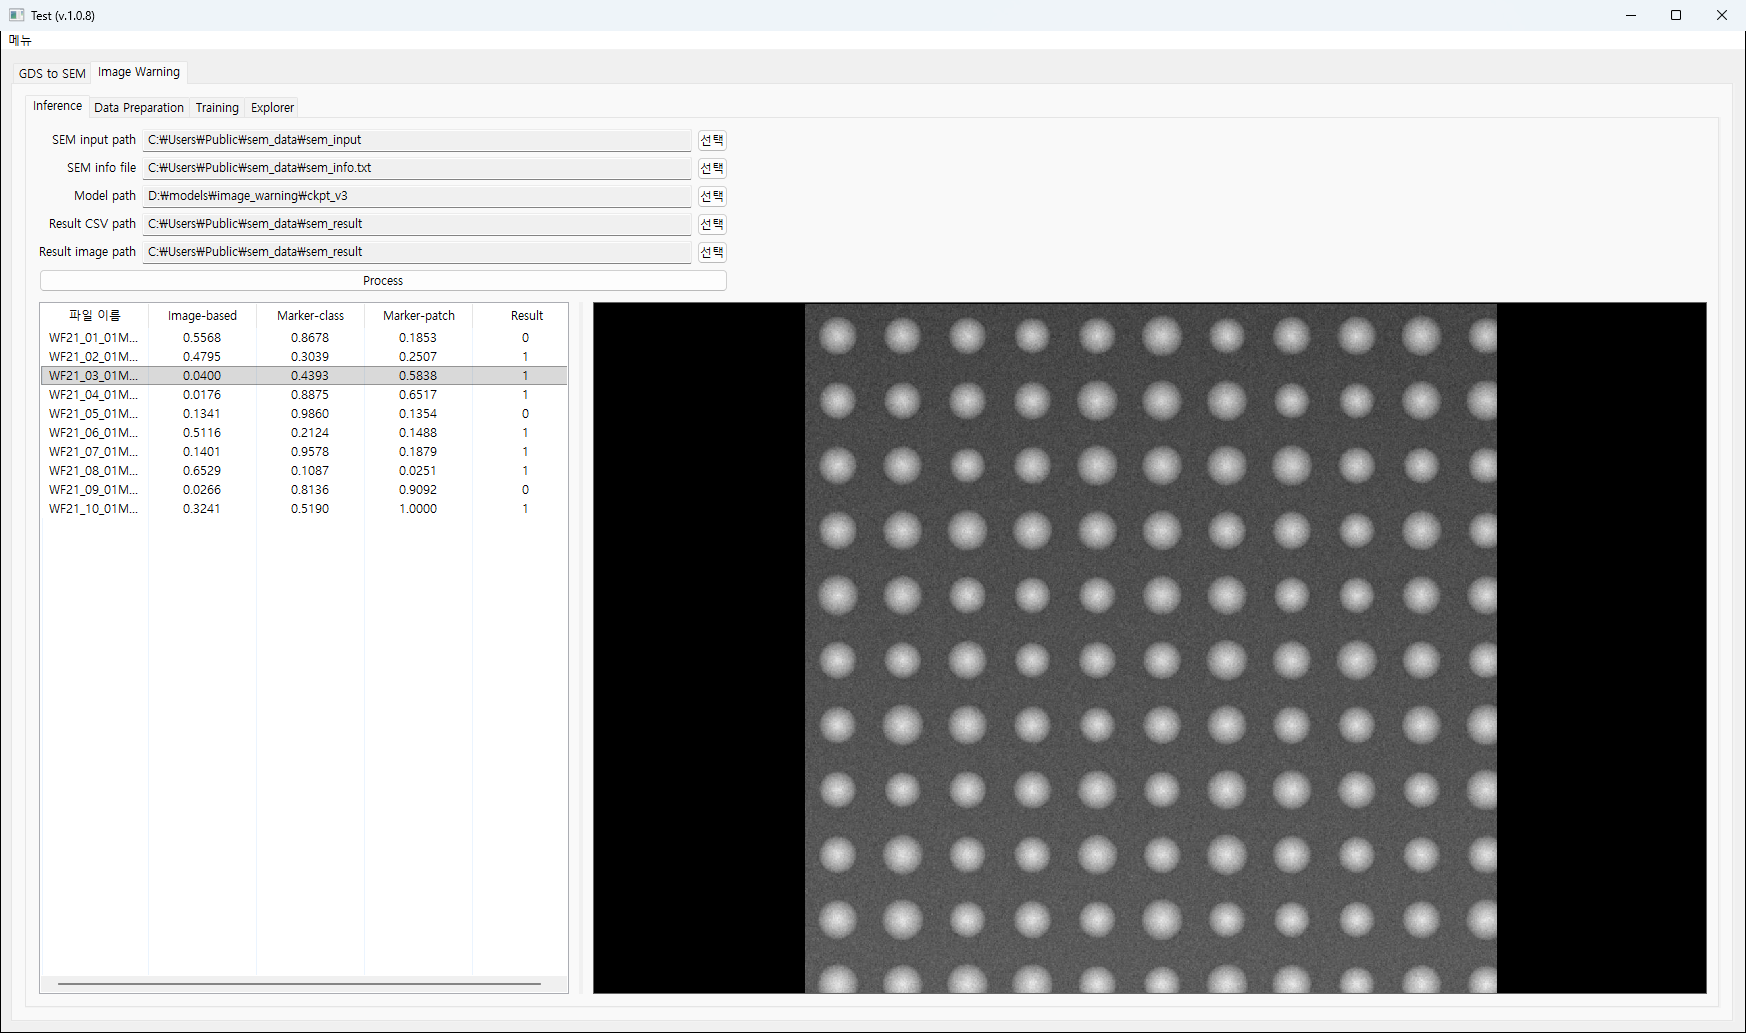
- Inference — point the app at a SEM image folder and a model, run it, and the result CSV is read back as a table; selecting a row shows the matching result image
- Data Preparation — for the image model, generate distorted variants of the originals and step through original and generated side by side. For the marker model, classify images, separate markers and sort the results in a list
- Training — configuration editing, training runs and log viewing for the image model and the marker model separately
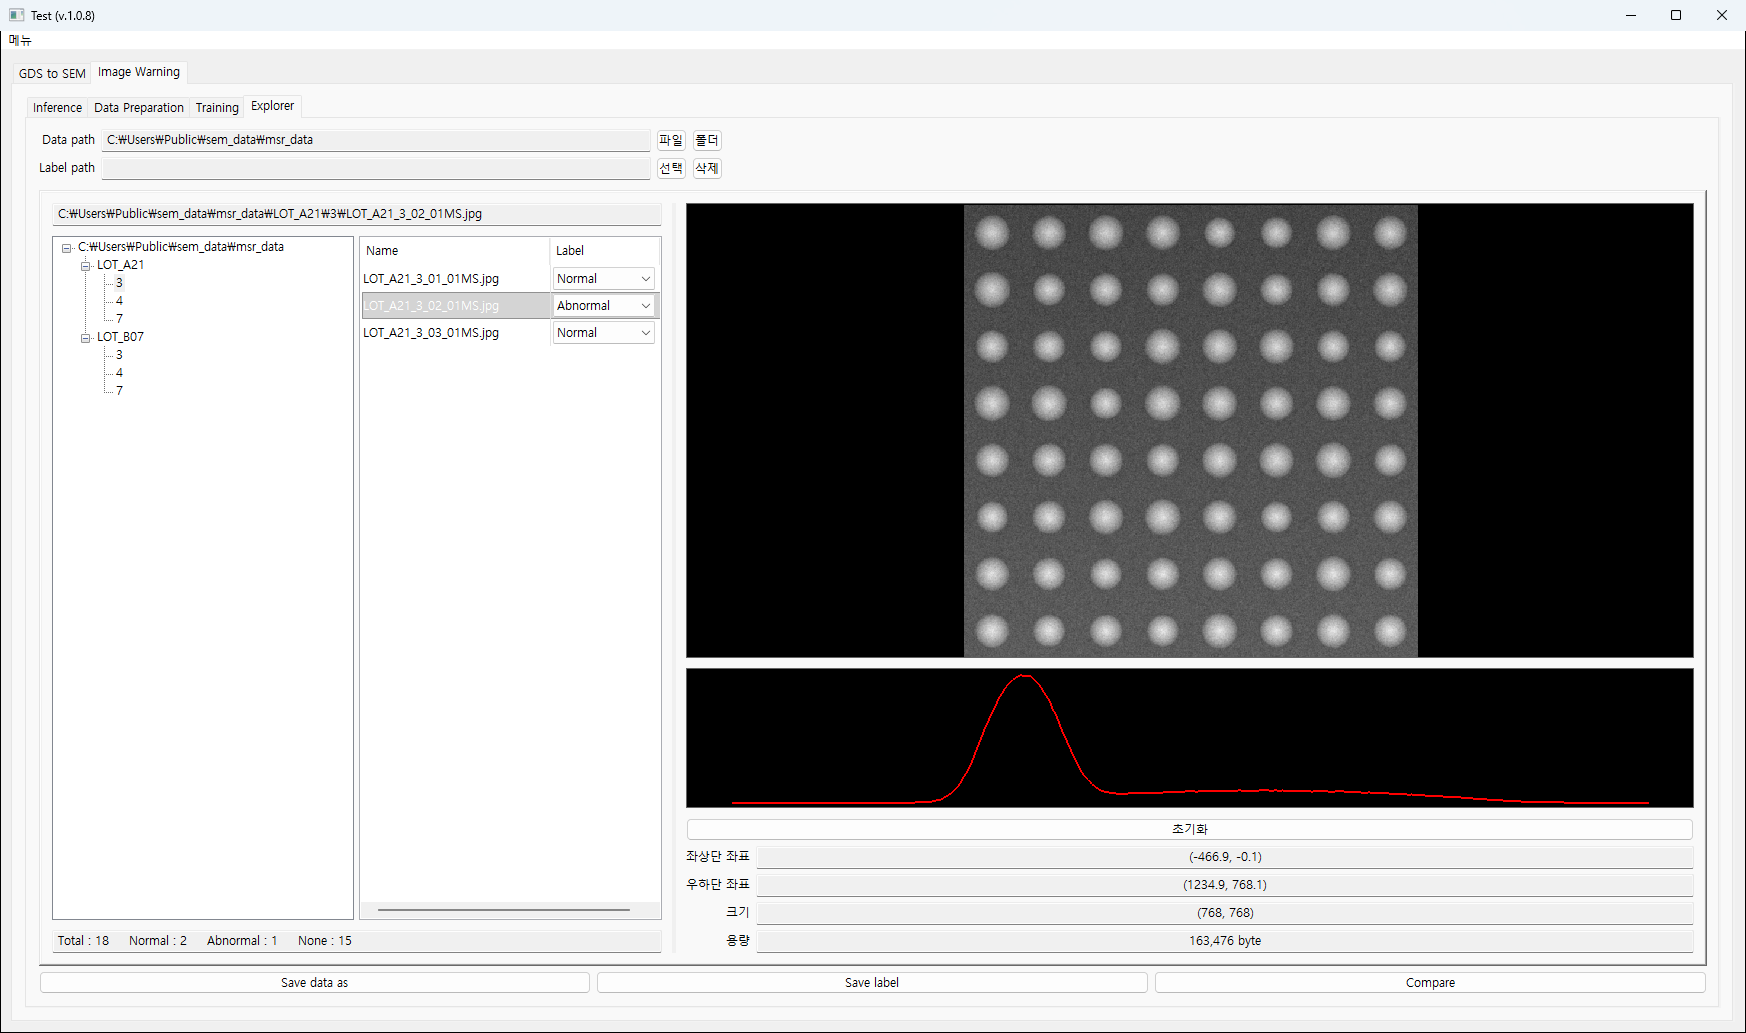
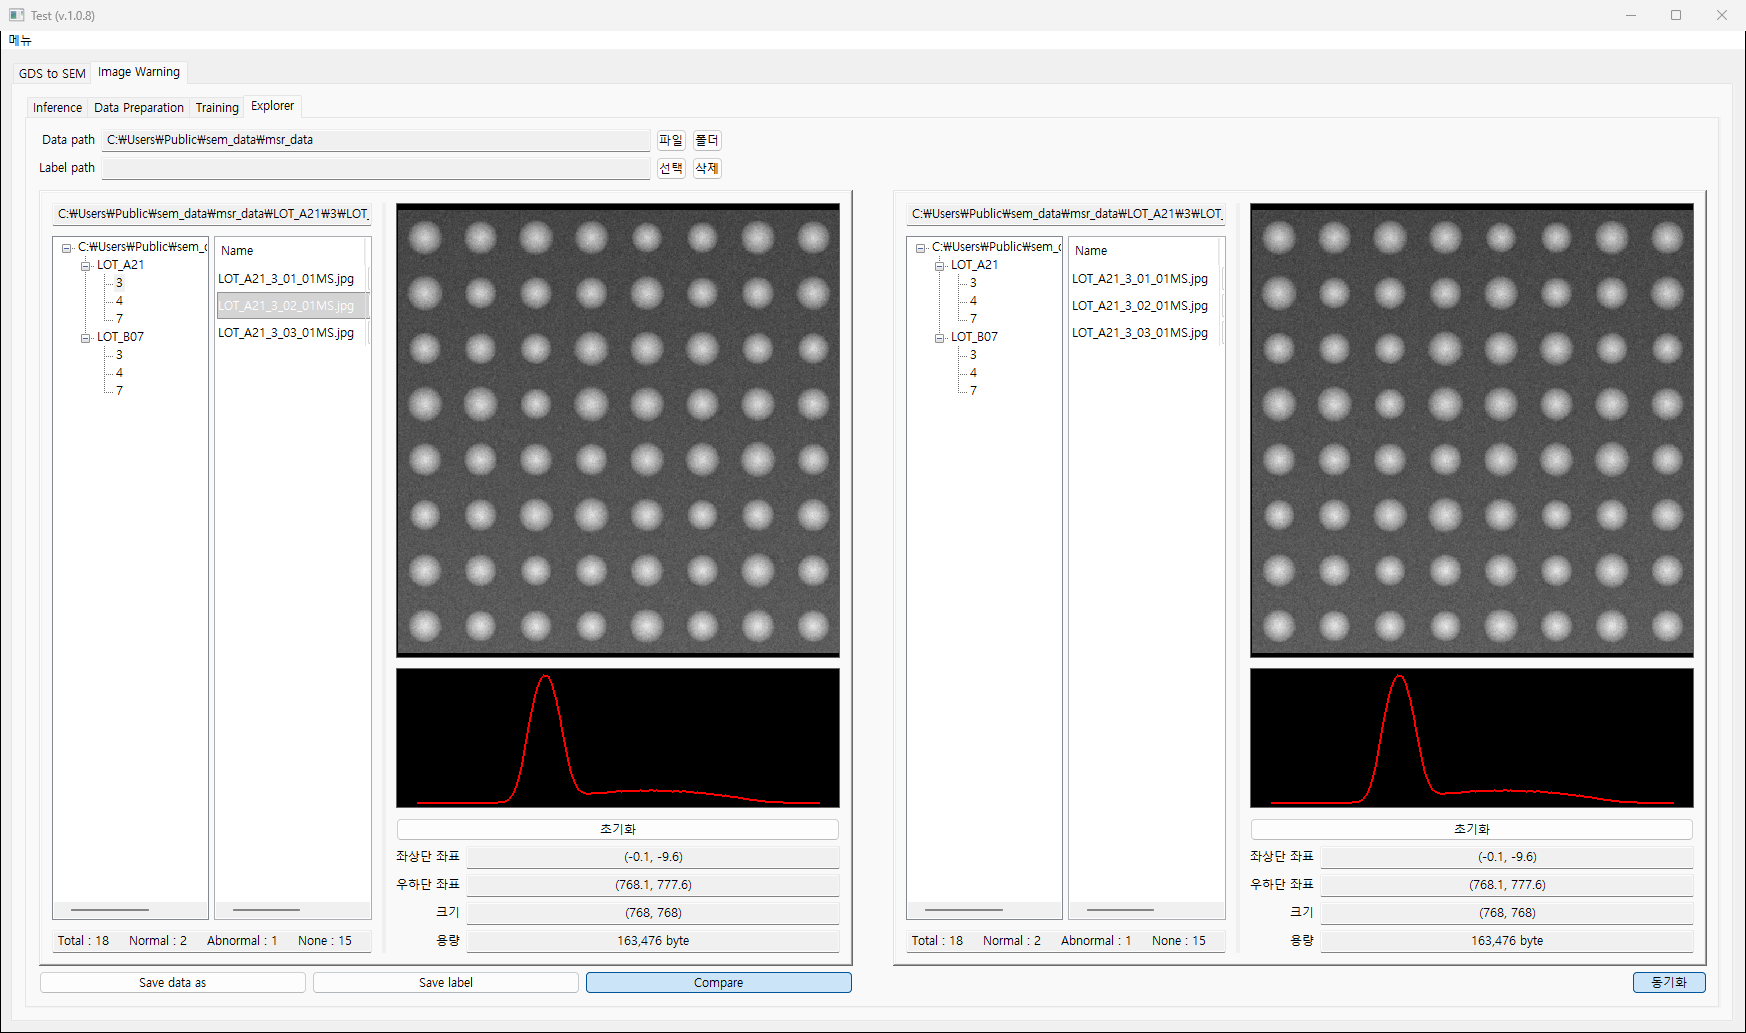
- Explorer — read MSR files to lay the data out as a lot and measurement point tree, and assign a Normal, Abnormal or None label to each image. Labels are written to and read from CSV, and the data can be exported again in whichever of the three folder shapes is wanted
System architecture
Layers
- UI layer — one panel per tab, in nested notebooks where the outer tab is the module and the inner tab is the stage of work
- Widget layer — image canvas, crop box, overlay canvas, histogram, YAML editor, directory tree, explorer
- Utility layer — MSR parsing, image discovery, array conversion
- Script layer — training and inference scripts, invoked only through
subprocess
Data flow
When the user picks the paths, the UI assembles the arguments and launches the external script. The script writes its result CSV and image files into the designated folders. While it runs, the app reads standard output to update progress and the log; when it finishes, the app reads the output files back and renders them as a table and images. The only contract between model and app is the command-line arguments and the file formats — the app imports no model library at all.
Implementation
GPU canvas
Every image view sits on a VisPy scene graph. A subclass of PanZoomCamera reports back whenever the view changes, and that callback keeps the on-screen readout of the currently visible region up to date. Explorer synchronization is done by linking the two cameras, so panning or zooming one view carries the other to the same place.
Crop box
The crop box is drawn in canvas pixel coordinates and converted to image coordinates through node_transform at the moment of cropping. That way the rectangle on screen is exactly the region that comes out, whatever the current zoom level.
Overlaying two images
The alignment canvas carries two images under independent STTransforms. Ctrl+drag moves the layout, Alt+drag moves the SEM image, and scale and opacity are set separately with sliders. Cropping undoes each image's own transform before cutting, then alpha-composites the two crops into a third image, so all three are saved together.
MSR parsing
The measurement point number comes from the $result line and the image file name from the &mp_image_name line. The parser then tries the three folder arrangements in order until it finds the file on disk. On export, the Save data as dialog offers the same three shapes and copies the data into whichever is chosen.
Progress and error handling
Long-running work reads the child process's standard output line by line. Classification runs are matched against a [3/20] pattern to drive a determinate progress bar; training runs stream their whole output into the log pane. Event handlers are wrapped in a shared decorator, so an unexpected exception shows its traceback in a dialog instead of taking the app down.
Open source license notices
The full license texts of the open source components shipped with the app — wxPython, Pillow, NumPy and VisPy — open directly from the menu.
Result
Data preparation, training, inference and result review all happen in one window, without running the model scripts by hand. MSR files open as they come off the tool, with no manual rearranging of folders, and labels persist as CSV so they feed straight back into the next training run.
Because an alignment is saved as three cropped images, how a training pair was built stays recorded in the files. Data can also be exported in whichever of the three folder shapes the model side expects.
Model and app are joined only by command-line arguments and file formats, so the app keeps working across changes to the model code as long as that interface holds.
Technology
- Python
- wxPython
- VisPy
- OpenCV
- Pillow
- NumPy
Screens
Have a project in mind?
Tell me about the problem and where things stand, and we can work out the right approach together.
Discuss a project