Engineering · 2024
Tire Road Noise Prediction Tool
A desktop program for checking a vehicle's cabin noise from measurement files
A Windows desktop program that loads per-wheel measurement files and stored vehicle data, computes the cabin noise spectrum, overlays it against reference measurements for comparison, and exports the result to a file.
- Client
- Confidential client
- Category
- Engineering
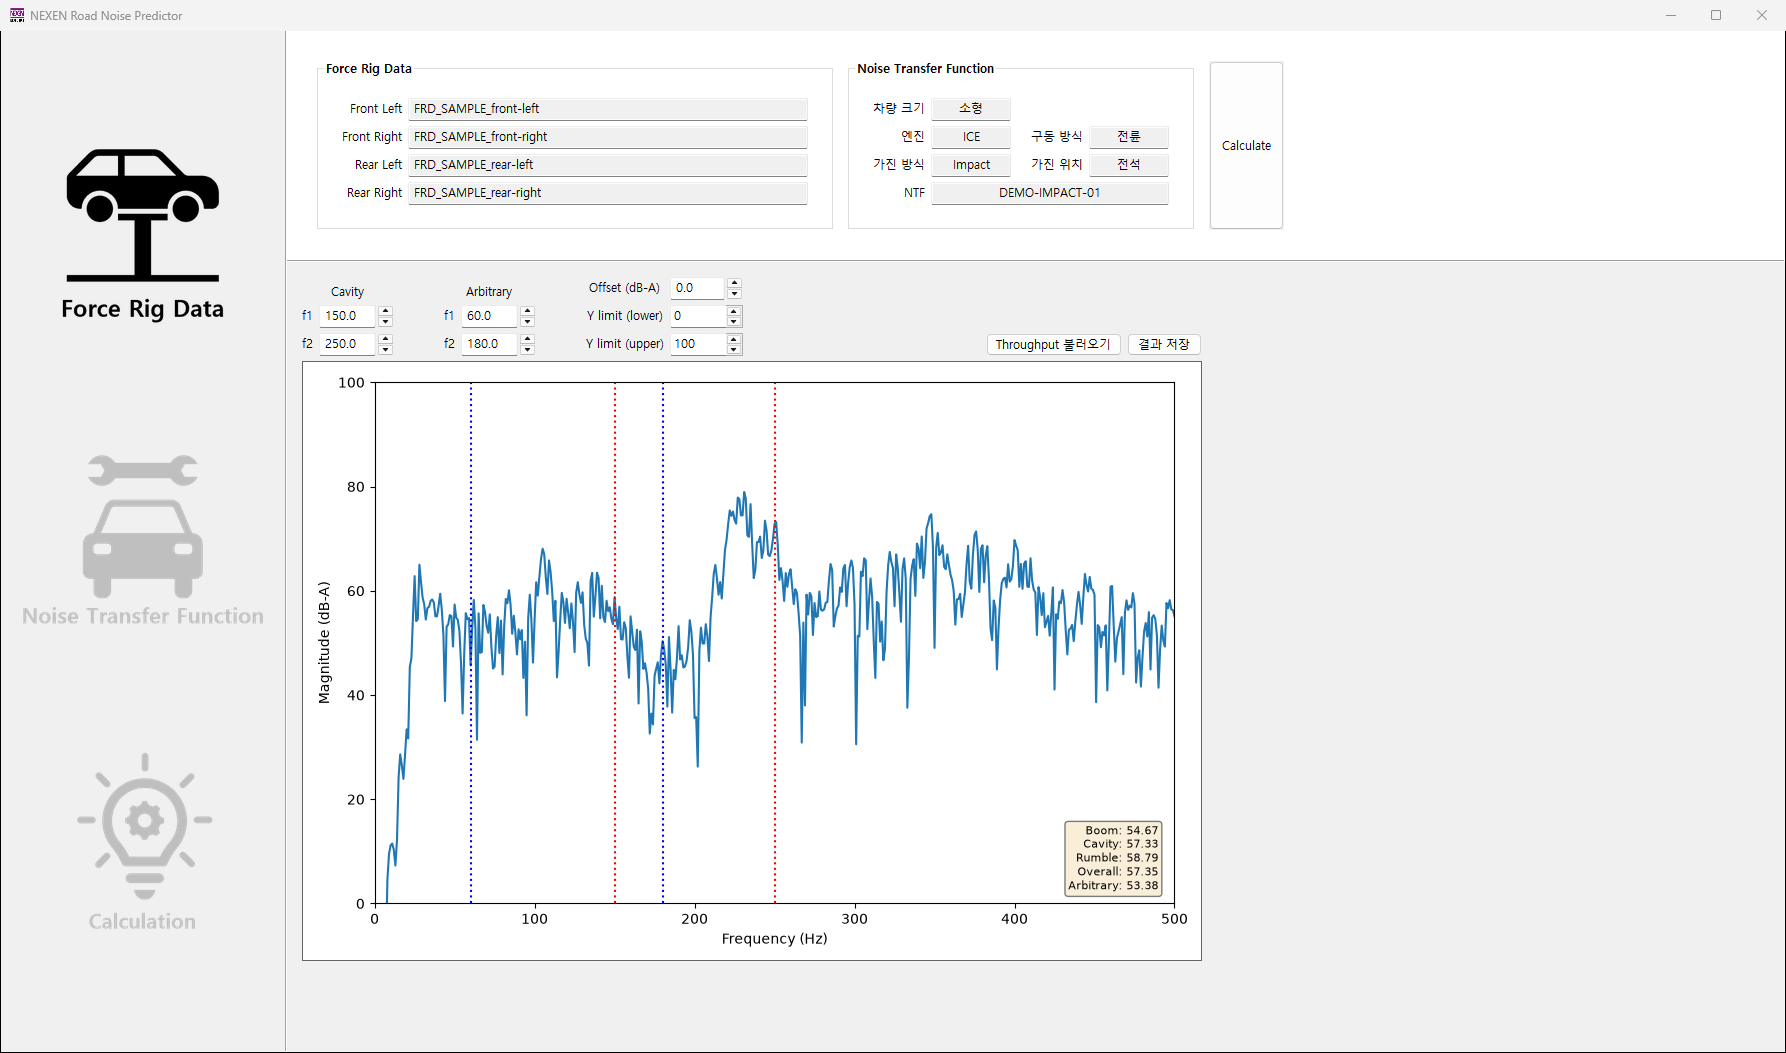
Overview
Road noise is what a driver hears inside the cabin when vibration from the road surface travels into the car. How loud it gets is not decided by the tire alone — it depends on the vehicle the tire is fitted to — so any assessment has to bring tire-side measurements and vehicle-side data together.
This program loads both in one place and plots the resulting cabin noise spectrum. The user points to the measurement files, picks one of the vehicle entries held in the program, and sees the expected result for that combination.
It is a Windows desktop program with three screens: measurement review, vehicle data management, and calculation.
Challenge
Checking a single case meant opening several files in matched pairs, reconciling their formats by hand, and copying the result out somewhere else.
- Measurement files are split by wheel position, so which file belongs to which corner has to be confirmed every time
- Vehicle data comes in different file layouts depending on its type
- Files differ in range and spacing, so they cannot simply be combined
- The work grows with the number of cases, and it is hard to trace afterwards which vehicle entry a result came from
Solution
Everything from picking the files to saving the result now happens inside one program.
Measurement screen
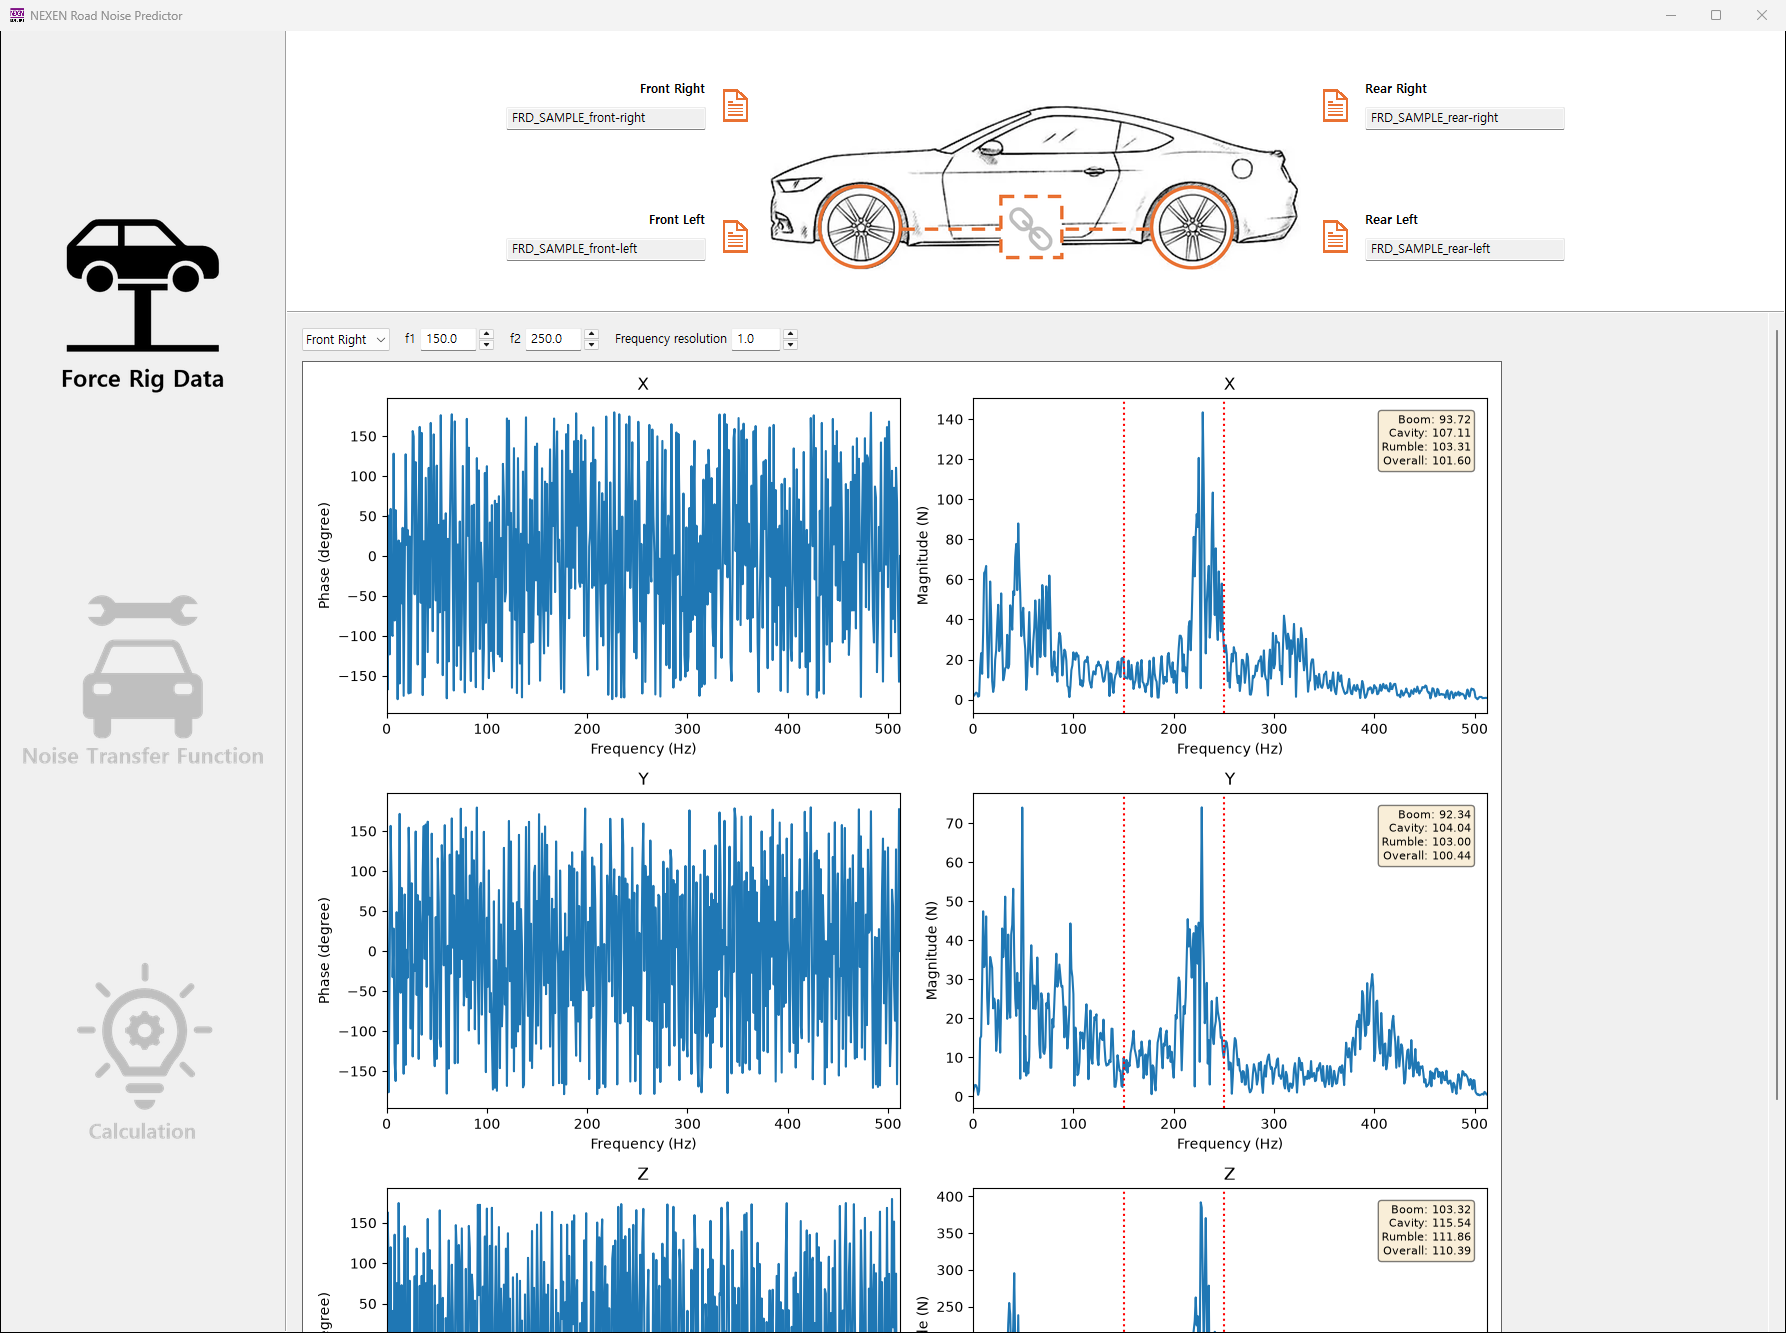
Files are dropped onto their wheel positions on a car diagram, or picked from a dialog. Turning on the link icon in the middle applies the front file to the rear as well, so a set of four identical tires needs only two files. Loaded data is plotted per axis, and switching the wheel position at the top of the screen brings up that corner's plots.
Vehicle data screen
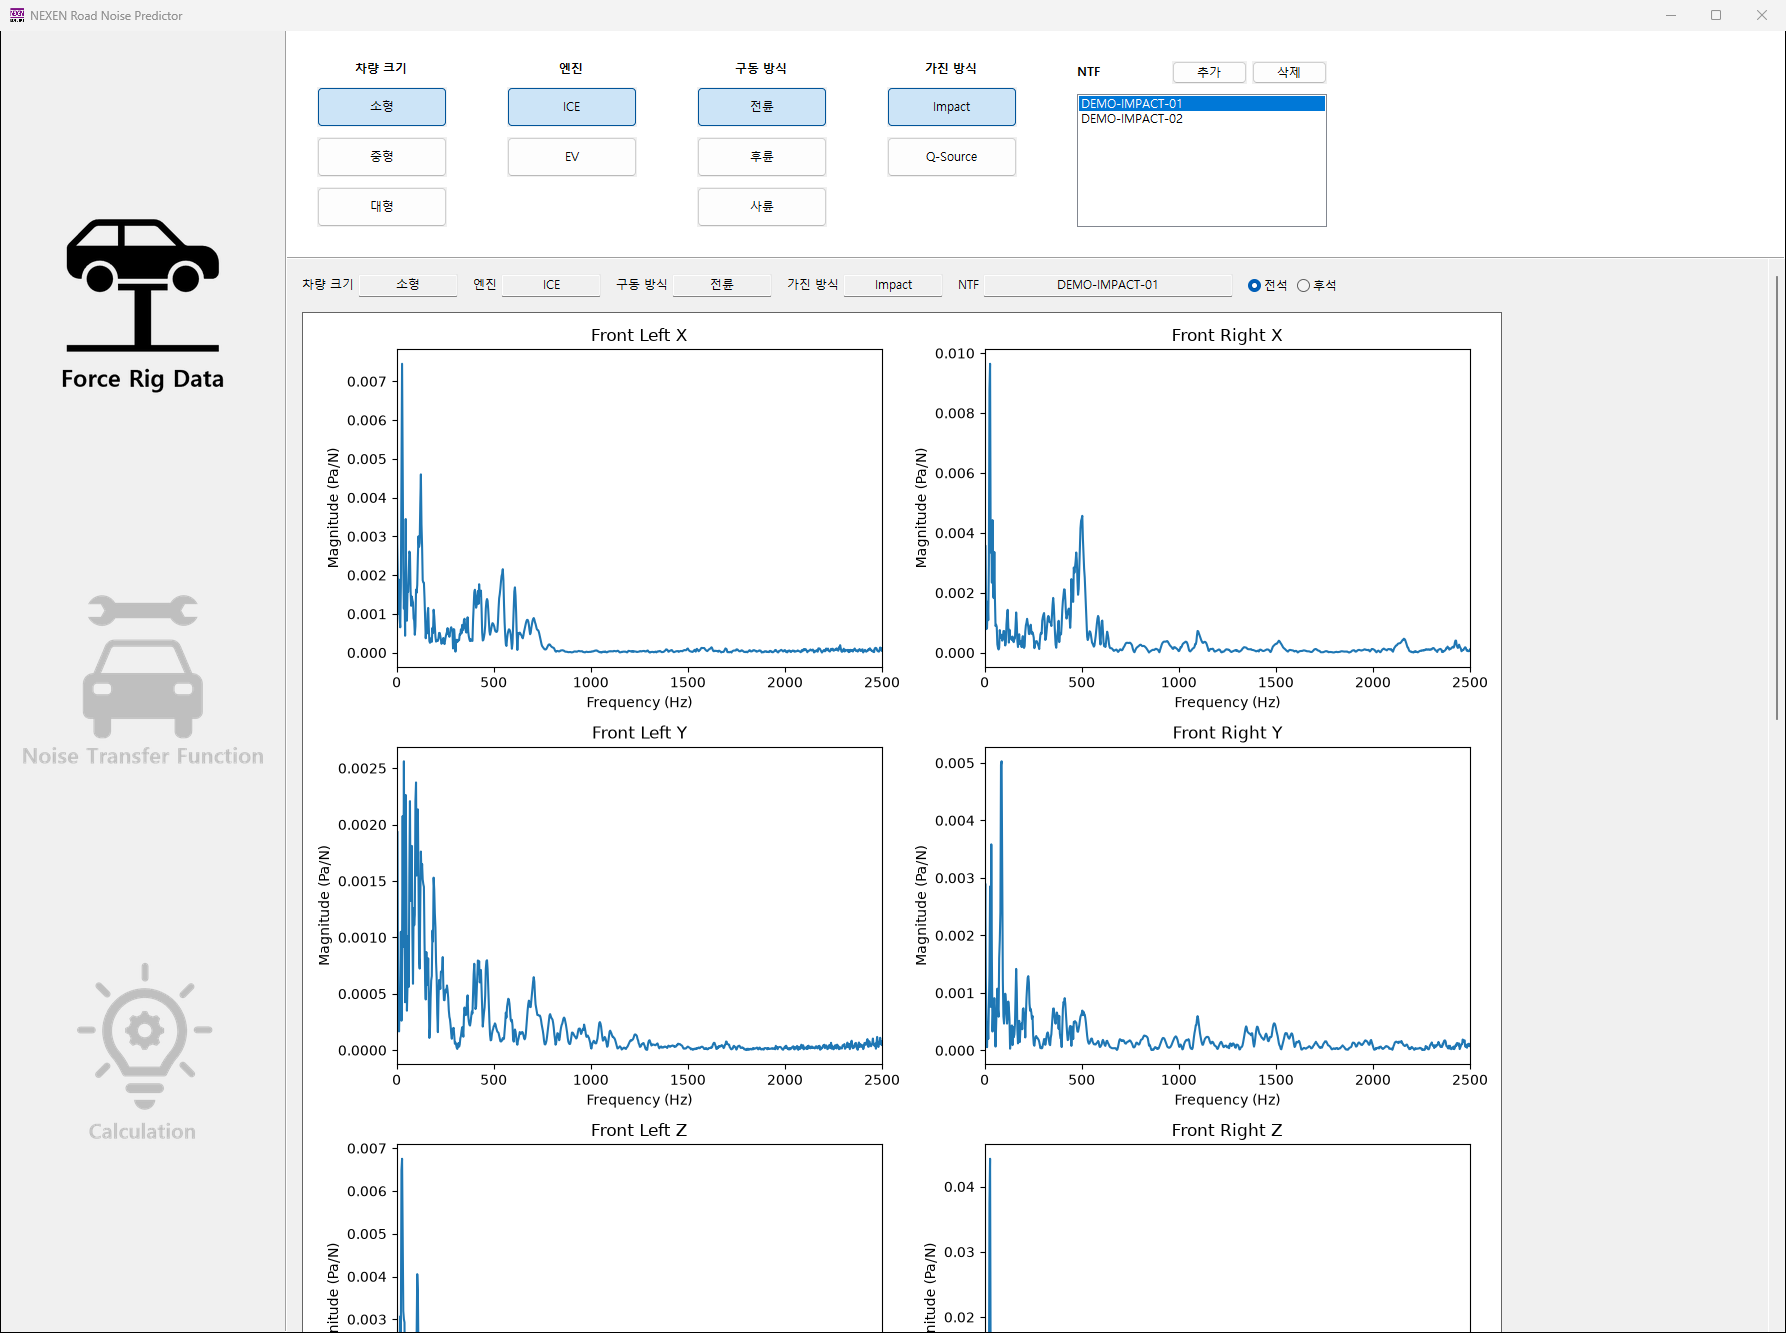
Entries are filed by combinations of vehicle conditions. Registering a new one from its files stores it as a single bundle, and selecting it from the list immediately plots the curves for each wheel position. A button switches which seat position is shown. Unwanted entries can be removed from the same list.
Calculation screen
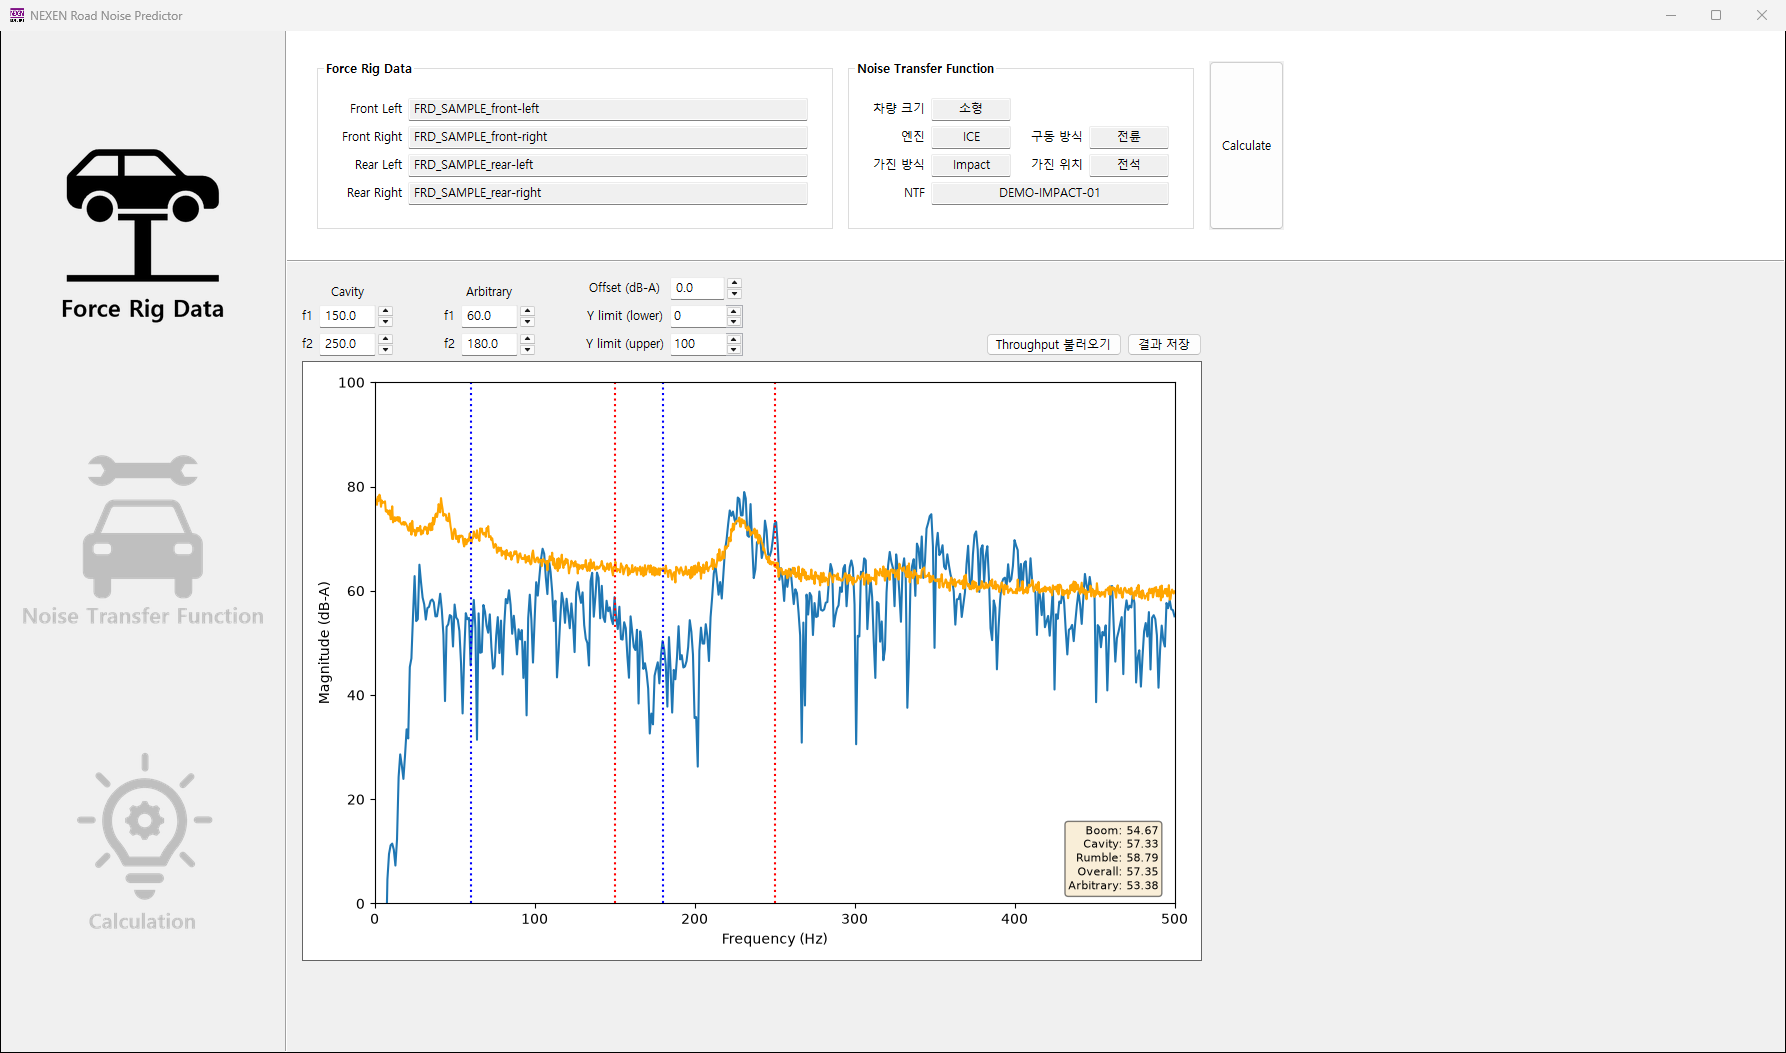
After confirming the selected entries, running the calculation plots the cabin noise spectrum. Summary values per band are shown alongside it, and band edges can be moved by left- and right-clicking the plot. The display range and an offset are adjustable on screen.
A reference measurement can be loaded and drawn on the same axes for comparison, and results export to CSV.
System architecture
- A single wxPython desktop program; an icon menu on the left switches between the three screens
- Plots are matplotlib canvases embedded directly in the window, taking mouse input on the plot itself
- Vehicle data lives in one file next to the program — no server and no separate setup step
- Data bundles are serialised as they are and restored on read
- The storage file and its structure are checked at startup, and the file is created if missing
Implementation
Input validation
Format and structure are checked at the moment a file is selected, and a mismatch is reported as a message naming the file and the problem. After the calculation is started, the program also confirms that every required entry is filled in and points out what is missing.
Progress for long operations
A progress window is shown while files are read and the calculation runs, so the program never looks frozen, followed by a completion notice when it finishes.
Managing stored entries
Vehicle entries are added and deleted from the list. Registering a duplicate name under the same conditions is blocked.
Exporting results
The CSV export records not only the values visible on the plot but also the vehicle data used in the calculation, so the result file alone shows which conditions produced it.
Result
A cabin noise prediction can now be seen on screen simply by pointing the program at the measurement files. Because vehicle entries accumulate inside the program, putting one set of measurements against several vehicle conditions, or several measurements against the same condition, happens on a single screen.
Opening files in pairs and reconciling their formats has moved into the program, so the same input goes through the same steps every time. Overlaying a reference measurement makes it possible to check, in place, how closely a calculated result tracks the real one.
Technology
- Python
- wxPython
- NumPy
- SciPy
- pandas
- matplotlib
- SQLite
Screens
Have a project in mind?
Tell me about the problem and where things stand, and we can work out the right approach together.
Discuss a project