Business System · 2025
Development Project Schedule Management System
An in-house desktop app and API server that put every development project on one Gantt timeline
Built a desktop client and API server so a manufacturing company's development schedules live on one shared Gantt timeline instead of in separate per-project files.
- Client
- Confidential client
- Category
- Business System
Overview
This is a project schedule management program for the development organisation of a manufacturing company. A single development project runs through an ordered chain of tasks, such as design review, mould production, prototype build, testing and approval, and many of these projects run at the same time.
Engineers log in through a desktop app and see their own projects and everyone else's on the same timeline. Projects, tasks, assignees and comments are held by an API server, so nobody has to pass schedule files around to look at the same information.
Challenge
Keeping a schedule file per project makes the order inside one project clear, but it makes comparing projects against each other hard. The system was built around these conditions.
- Dozens of projects, each with dozens of tasks, have to be comparable on one screen
- Users need to switch between a close view of a few weeks and a wide view of several months
- Accounts and permissions have to be separated: only an administrator may create accounts or delete projects
- The reason behind a schedule change has to stay with the project as a note
Solution
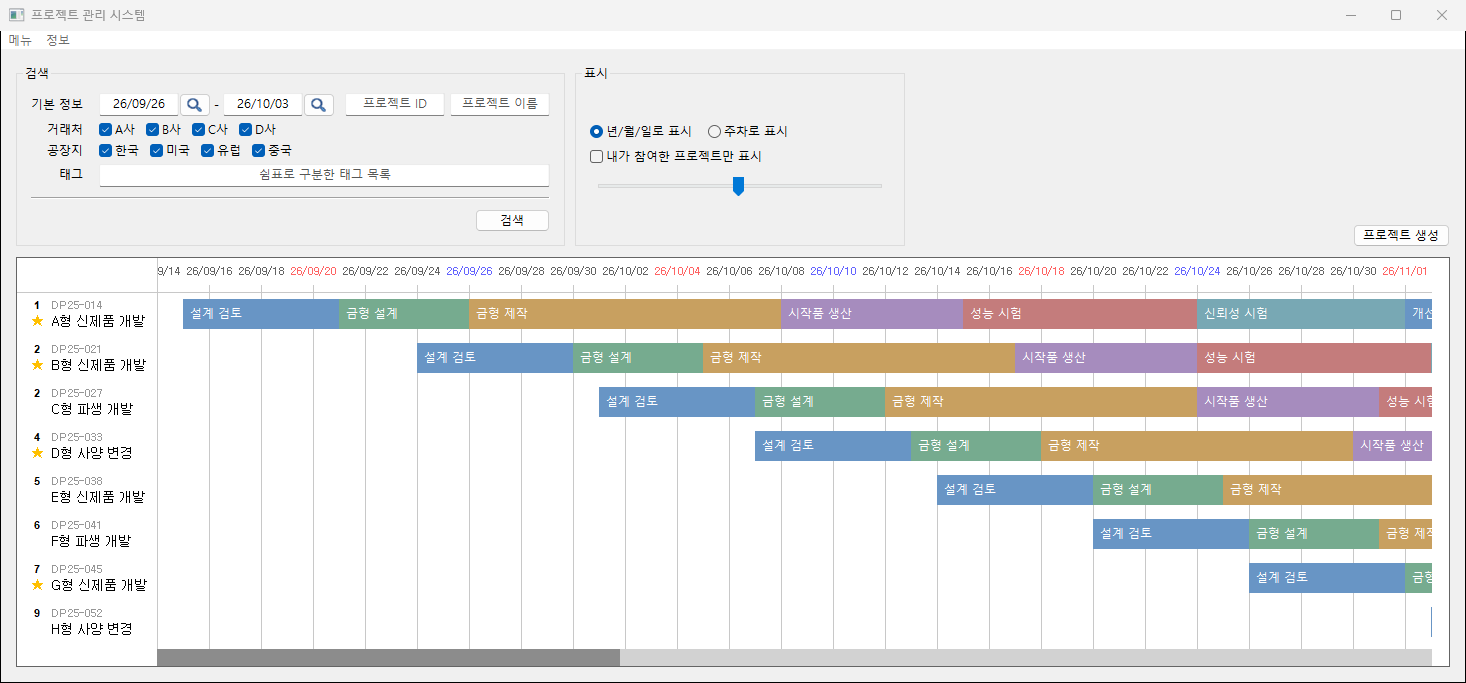
The main screen puts the project list on the left and a date axis on the right. Each row is one project, and that project's tasks sit on the row as coloured bars. Next to the project name are its display priority and a mark showing whether the current user is on the project.
- A slider changes the pixel width of a single day, from a close day-by-day view to several months at once
- Date ticks space themselves according to that width, and Saturdays and Sundays are drawn in distinct colours
- Horizontal and vertical scrolling, the mouse wheel and the arrow keys move the view while the project column and the date header stay fixed
- A panel across the top holds search fields such as period, customer, plant location and tags, alongside the display options
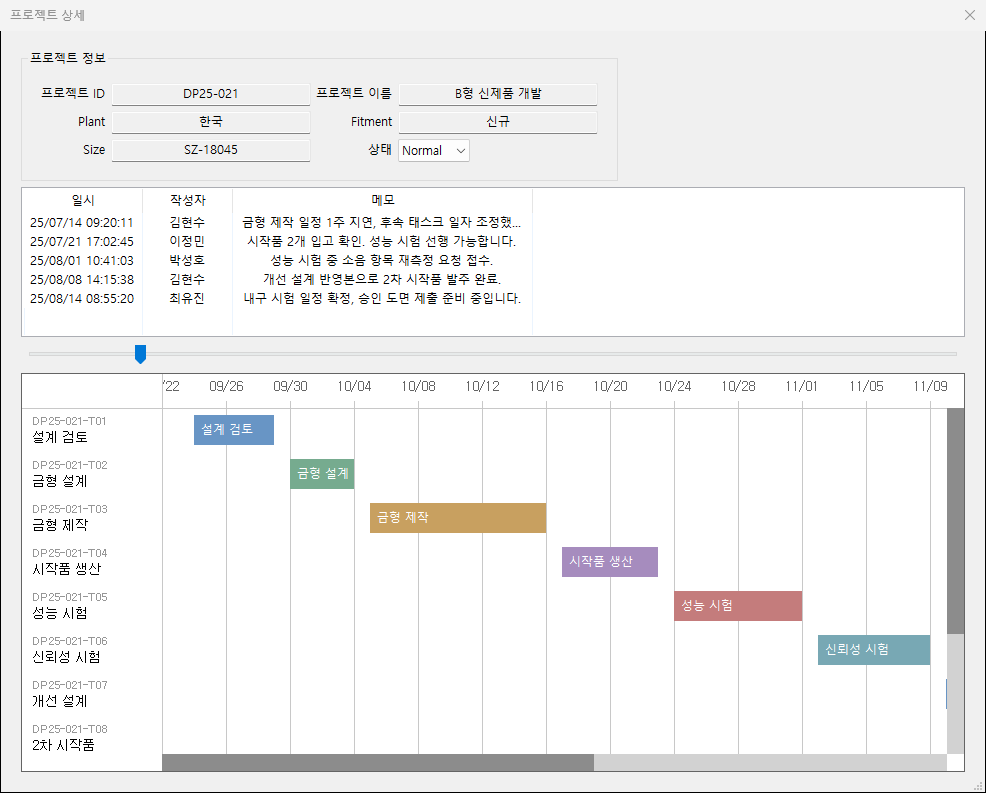
Clicking a project name opens the detail screen, which shows the project's attributes and comment history, and a Gantt chart with one row per task. Dragging either end of a task bar adjusts its duration.
System architecture
Components
- Desktop client: Python with wxPython, responsible for the screens and the Gantt rendering
- API server: FastAPI, exposing authentication, account, project, task and comment endpoints
- Database: accessed through the SQLAlchemy ORM, running on SQLite during development
Data flow
- The client logs in with an ID and password, and the server issues a JWT
- Every later request carries that token in its header, and the server reads the user and permissions from it
- The server shapes responses with Pydantic models, and the client parses them with matching models before drawing them
Data model
- Engineer, carrying administrator and team lead flags
- Project, with plant, fitment, size, status and created and updated timestamps
- Project-engineer, a many-to-many link assigning several engineers to a project
- Task, with start date, end date, status and a reference to its preceding task
- Comment, kept per project with its author and timestamp
Implementation
The Gantt chart is drawn directly rather than built on an off-the-shelf widget, because the project rows, task bars, date header, frozen regions and scrollbars all had to behave in a specific way.
- Double buffering removes flicker on redraw, and only the rows currently in view are painted
- The scrollbars are drawn by hand as well, handling thumb drags and track clicks while the project column and date header stay in place
- When a day gets narrower, the tick spacing is recalculated so date labels are drawn at intervals instead of overlapping
- The text on a task bar switches between black and white depending on the brightness of the bar colour
- On the detail screen, a press within a few pixels of a bar's edge starts a duration adjustment, while a press in the middle selects the task
On the server, permissions are expressed as dependencies. One checks for a logged-in user and another for an administrator, and attaching the latter keeps account creation, account deletion and project deletion restricted. Passwords are stored as bcrypt hashes, and issued tokens carry an expiry. The client also shows or hides its administrator menu based on the permissions returned at login.
Result
Task schedules from different projects can now be compared against the same timeline. Changing the day width moves between a few days of detail and several months of overview without leaving the screen.
Project attributes, assignees and comments sit together on the server, so each person reads the same information from their own screen instead of exchanging schedule files. The reason behind a schedule change stays with the project as a comment.
Accounts and permissions are managed from an administrator screen, and the actions reserved for administrators are checked again on the server.
Technology
- Python
- wxPython
- FastAPI
- SQLAlchemy
- Pydantic
- SQLite
- JWT
Screens
Have a project in mind?
Tell me about the problem and where things stand, and we can work out the right approach together.
Discuss a project