Engineering · 2024
2D LiDAR Detection Area Setup and Monitoring Tool
A desktop app that plots LiDAR scan data in real time and lets you draw the detection area directly on screen
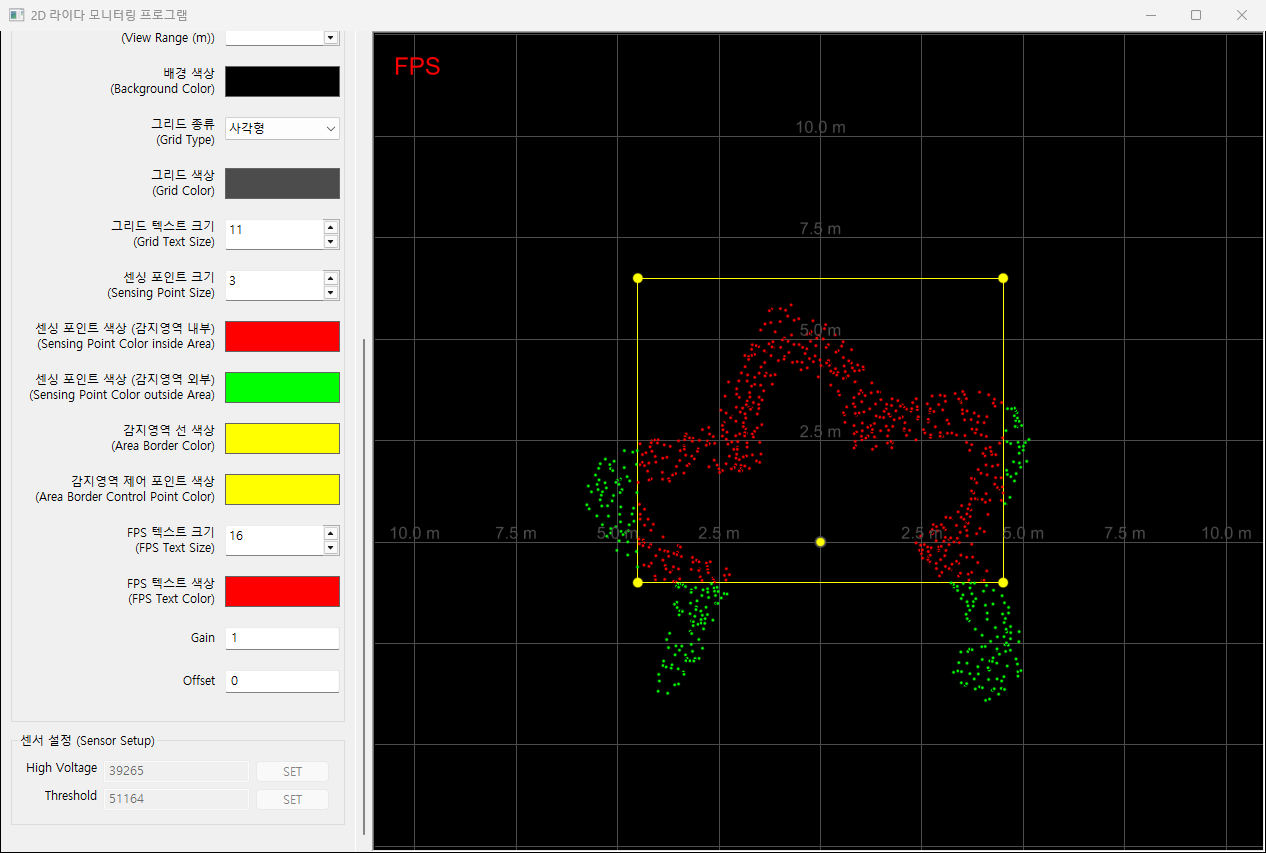
A Windows tool for industrial LiDAR safety sensors. Instead of typing coordinates, technicians drag the detection area into place on top of the live scan, and every scan point is colored by whether it falls inside or outside that area.
- Client
- Confidential client
- Category
- Engineering
Overview
This desktop application is how a LIDAR sensor is set up and watched from a PC. It plots incoming scan data in real time, lets the operator reshape and resize the detection area directly on the canvas, and sends sensor settings back to the device. It is used by the technicians who install the sensors and by the staff who adjust detection coverage on site.
Challenge
The detection area differs at every installation. Aisle width, equipment placement, and the paths people walk all change it, so it has to be tuned each time a sensor goes in.
When the area is entered as coordinates or numbers, there is no way to tell what those values map to on the actual floor. The work turns into a loop: change a value, place an object, watch for a reaction, change it again. What the sensor currently sees, and whether those points land inside or outside the configured area, needed to be visible on one screen.
Solution
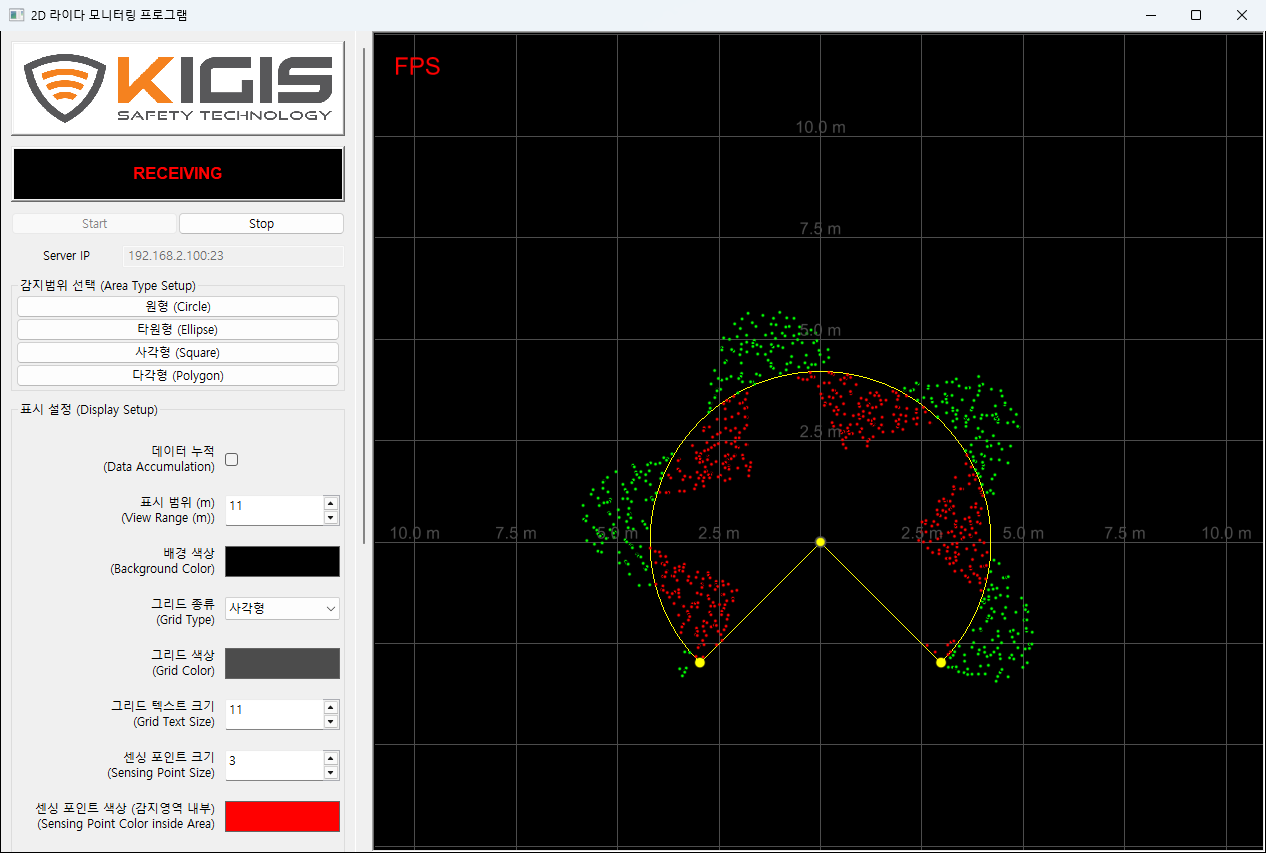
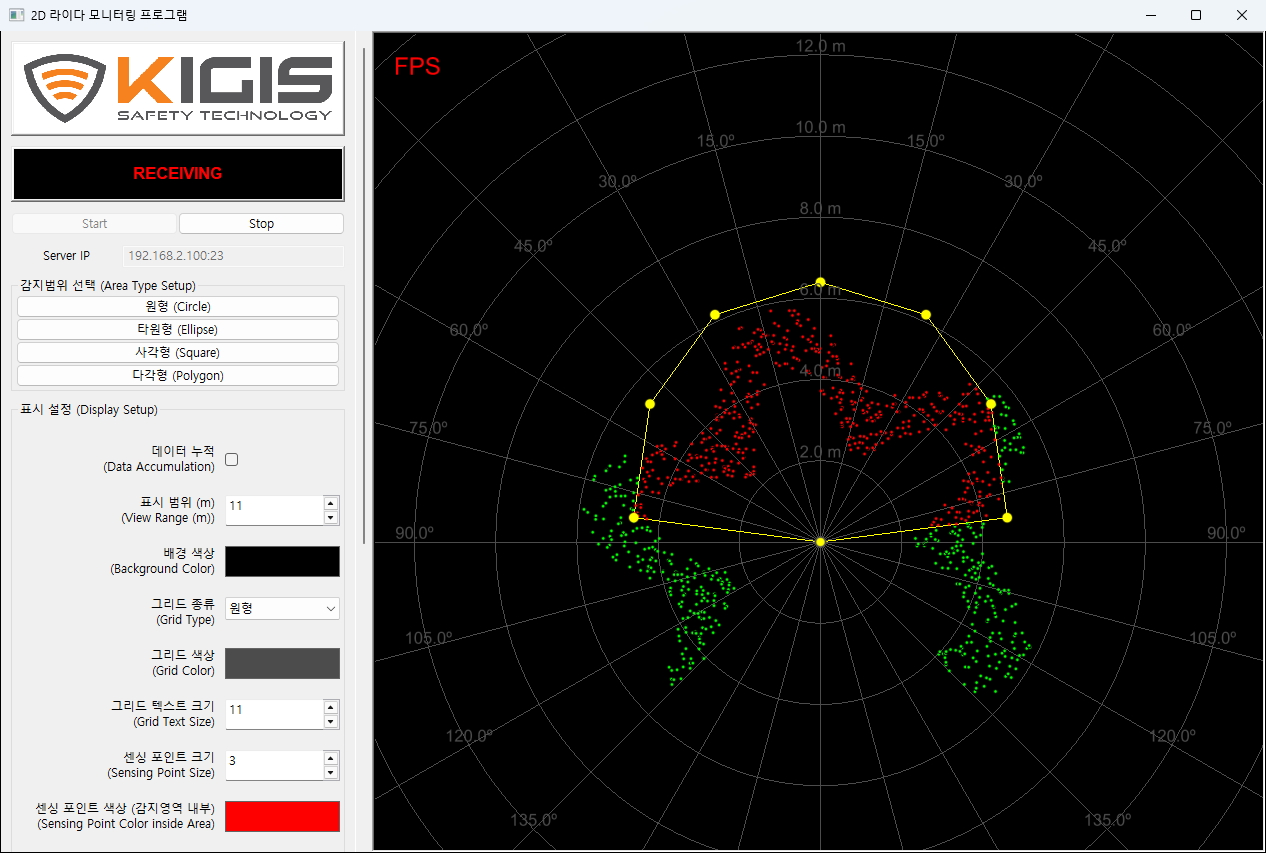
- The 900 distance readings are converted from polar to cartesian coordinates and plotted as points. Points inside the detection area are drawn in a different color from points outside it.
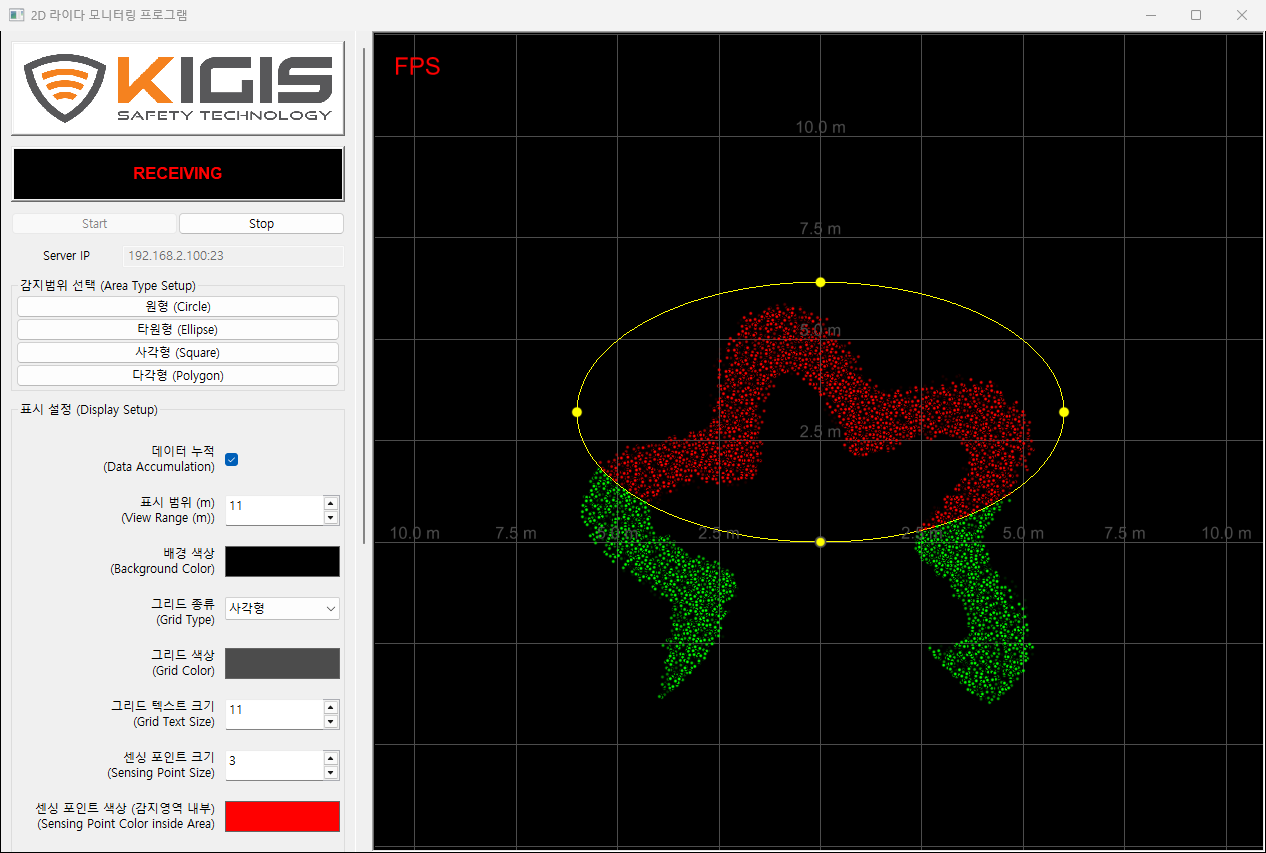
- The detection area can be a circle (a 270-degree sector), an ellipse, a rectangle, or an eight-point polygon. Each shape carries draggable control points, so the area is fitted by eye against the live scan.
- The sensor origin can also be dragged across the canvas, which keeps the view usable when the detection range sits off to one side.
- The alert sounds only after points have fallen inside the area on five consecutive scans, so a single stray reading does not trigger it.
- Accumulation mode overlays the last ten scans, fading older ones, which separates the trail of a moving object from fixed structures.
- High Voltage and Threshold values can be typed in and sent to the sensor. While data is being received, the values reported by the sensor appear in the same fields.
- Colors and sizes for the background, grid, scan points, and area border are all adjustable, along with grid type (cartesian or polar) and view range. On exit, the settings and the current area shape are written to
config.iniand restored on the next launch.
System architecture
- UI: wxPython, with a scrolling settings panel on the left and the canvas on the right.
- Rendering: a VisPy OpenGL scene canvas embedded in a wx panel. Redrawing 900 points every frame makes GPU rendering worthwhile.
- Communication: a TCP socket to the sensor. Data reception and alert playback each run on their own daemon thread, leaving the UI thread free.
- Detection areas: four classes inheriting from
BaseArea, each owning its border geometry, control point positions, and inside/outside test. Exactly one area is active at a time, tracked on a class variable. - Settings:
config.iniis read at startup to override the constants class, and rewritten on exit.
Data flow
- The sensor sends one frame: an 8-byte header, four 900-byte blocks, and a 4-byte tail carrying High Voltage and Threshold.
- The receiving thread pairs high and low bytes into distances in meters, then applies gain and offset.
- Each point is tested against the active detection area and assigned a color.
- The points are drawn, and any point inside the area pushes an alert flag onto the queue.
Implementation
Handling shifting frame boundaries
A single recv does not return a consistent number of bytes. A block that should arrive as 900 bytes sometimes splits into 854 and 946. The reader discards data until it sees the 8-byte header, collects six segments from there, then checks the total length. A frame that does not add up is dropped rather than drawn. If no header turns up within a set number of attempts, reception stops and the user is told.
Inside-area testing for the polygon
Circles, ellipses, and rectangles can be tested one point at a time against a simple expression. Doing the same for the polygon would mean 900 Python-level iterations per frame, so the polygon takes all 900 points at once and resolves them with NumPy array operations. In accumulation mode, where up to 9,000 points stay on screen, the difference matters more.
Drawing the grid as a single line
Building each grid line as its own visual multiplies the number of visuals on the canvas. Instead, the coordinates trace a line to its end, retrace it back, and continue into the next line, so the whole grid is one unbroken polyline. Tick spacing is snapped to a preset list of intervals (0.1, 0.2, 0.5, 1.0 and up to 10.0 m), which keeps the labels on round numbers as the view range changes.
Color picker
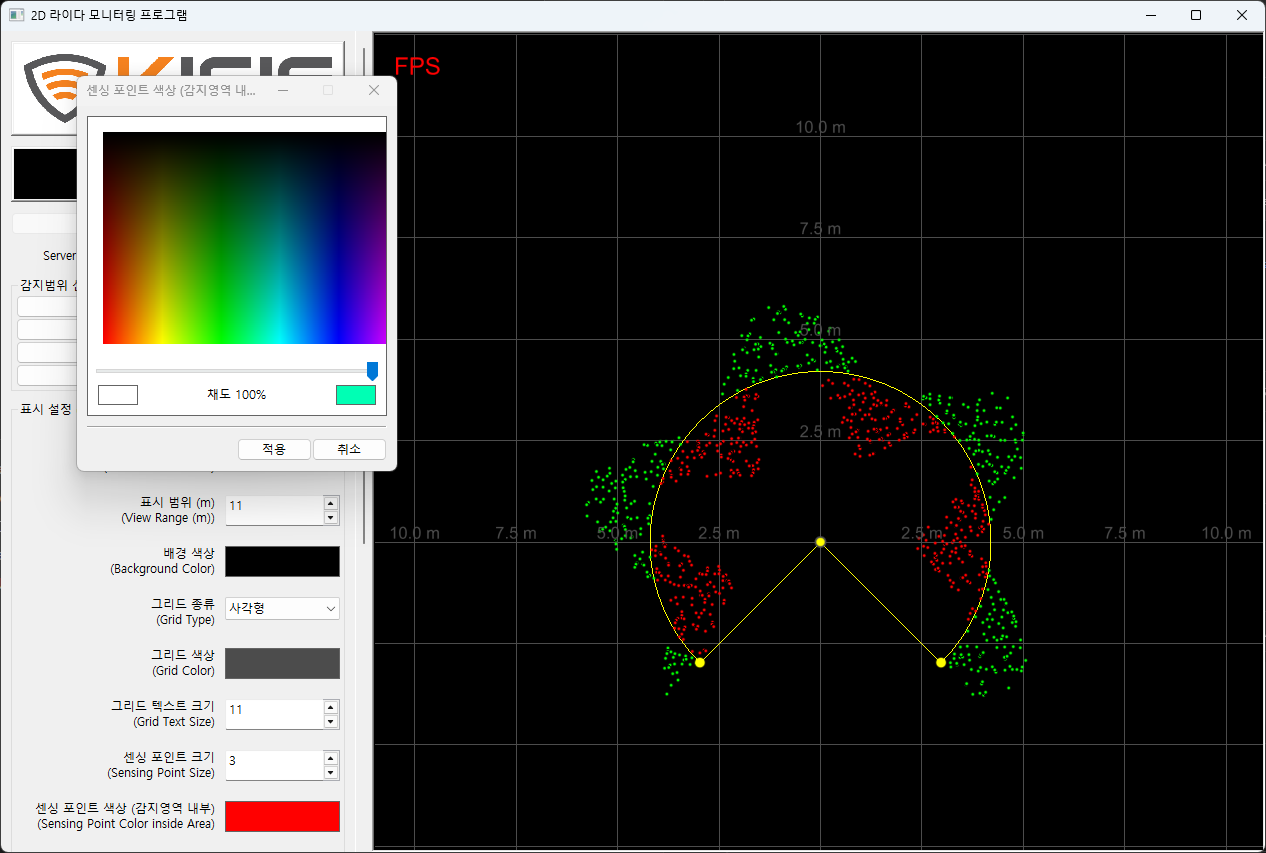
Rather than the OS color dialog, the app uses a custom window with an HSV plane and a saturation slider. Because most of the choosing is about how a point reads against a dark background, it shows the previous and the new color side by side.
Packaging
The app ships as a PyInstaller bundle. VisPy's shaders and the freetype data are not collected automatically, so the spec file lists them explicitly.
Result
Setting a detection area no longer means entering numbers and guessing at the outcome. The area is laid over the points the sensor is actually returning and dragged into place, and placing an object confirms the fit immediately as the point colors change.
Overlaying several scans in accumulation mode distinguishes a stray reading from a real object, and the consecutive-detection condition keeps such readings from setting off the alert.
Because display settings and the area shape persist to a file, a configuration tuned on site comes back intact the next time the program opens.
Technology
- Python
- wxPython
- VisPy
- NumPy
- OpenGL
- TCP/IP
- PyInstaller
Screens
Have a project in mind?
Tell me about the problem and where things stand, and we can work out the right approach together.
Discuss a project