Engineering · 2023
Time-Resolved Spectroscopy Acquisition Software for ICCD Cameras
A Windows desktop application that records and analyses images and spectra across a sweep of gate timings
Time-resolved measurements used to mean retyping the gate delay and re-arming the camera for every point. This application runs a prepared list of timings on its own and stores the camera settings alongside the frames, so a saved file carries the conditions it was taken under. Images, wavelength-calibrated spectra and export all live in one window.
- Client
- Confidential client
- Category
- Engineering
Overview
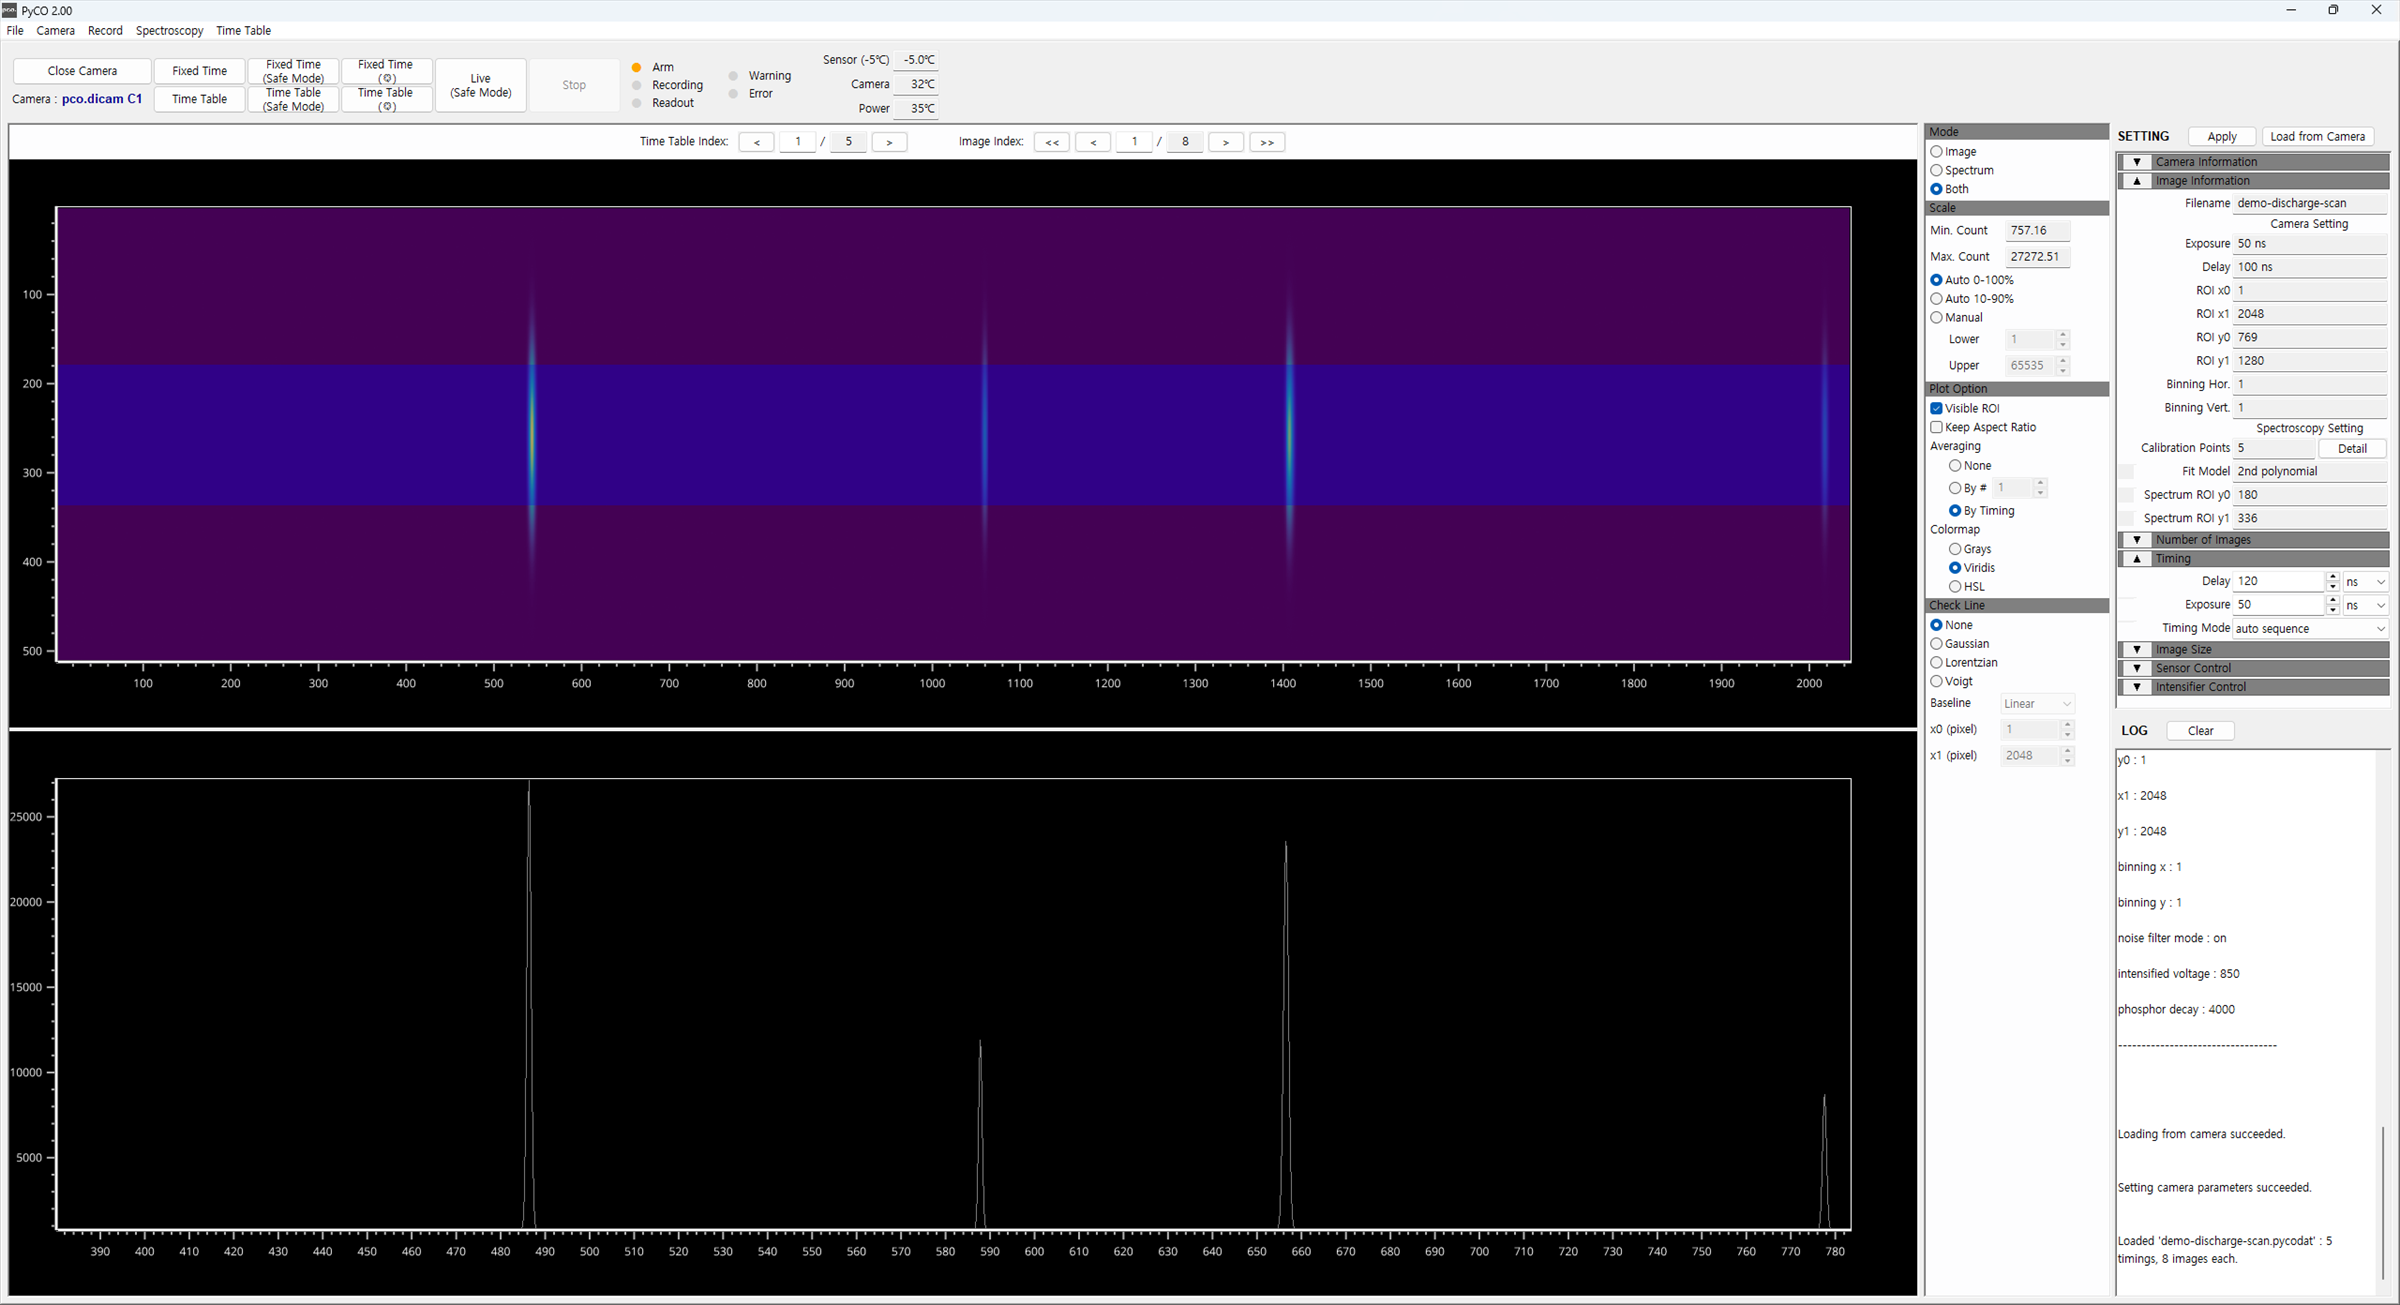
PyCO is a Windows desktop application that drives an intensified PCO camera (ICCD) to record time-resolved images and spectra. It steps gate delay and exposure in nanoseconds, shows each capture as both an image and a spectrum, and exports the parts worth keeping — all in one program.
It is used for experiments on short-lived light: electrical discharges, plasmas, and similar events that appear and fade in nanoseconds. The goal was to fold camera control, condition logging, wavelength calibration and spectral inspection into a single tool instead of four separate ones.
Challenge
The camera vendor's software controls the camera, but not the measurement. Everything between the two had to be done by hand.
- A time-resolved scan is the same capture repeated at shifting gate delays. Each delay had to be typed in and the capture re-armed every time.
- Exposure, delay, ROI, intensifier voltage and the rest lived apart from the frames, so matching a file back to the conditions it was taken under was its own task.
- Behind a spectrograph, the image's horizontal axis is pixels. Reading it as wavelength meant moving the data into another tool.
- The camera buffers frames in its own on-board memory. The wrong combination of image size and frame count only failed after the run had started.
Solution
The measurement procedure moved into the software.
Capture driven by a timing list
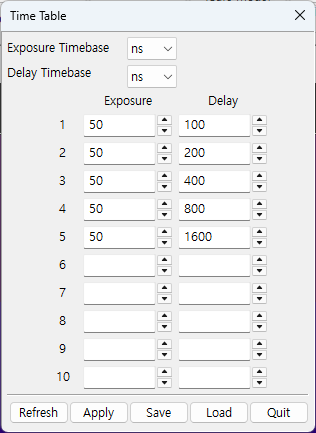
Up to ten exposure and delay pairs can be entered ahead of the run. The program sets the camera to the first timing, records the requested number of frames, then moves to the next on its own. Once started, it runs the list to the end without intervention.
Conditions stored with the frames
At the start of every capture the program reads back exposure, delay, trigger mode, ROI, binning, noise filter, intensifier voltage, gating mode, phosphor decay and the spectroscopy settings, and attaches them to the frames. One saved file holds both, so opening it later shows the conditions it was recorded under.
Pixels into wavelength
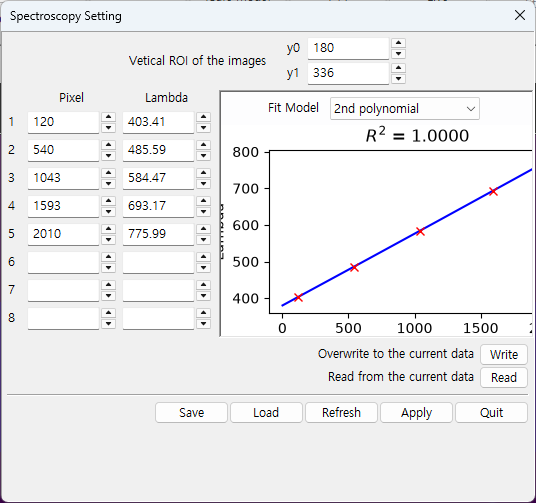
Entering a few known wavelengths against their pixel positions fits a polynomial of first to fourth order and converts the horizontal axis to wavelength. The fit is drawn with its coefficient of determination.
Guards during a run
Before arming, the program asks the camera how many frames it can hold and refuses to start if the request exceeds it, naming in the log which value to reduce. In Safe Mode it records one frame at a time and checks each one, stopping with a warning when any pixel passes 95% of the 16-bit full scale.
Analysis and export
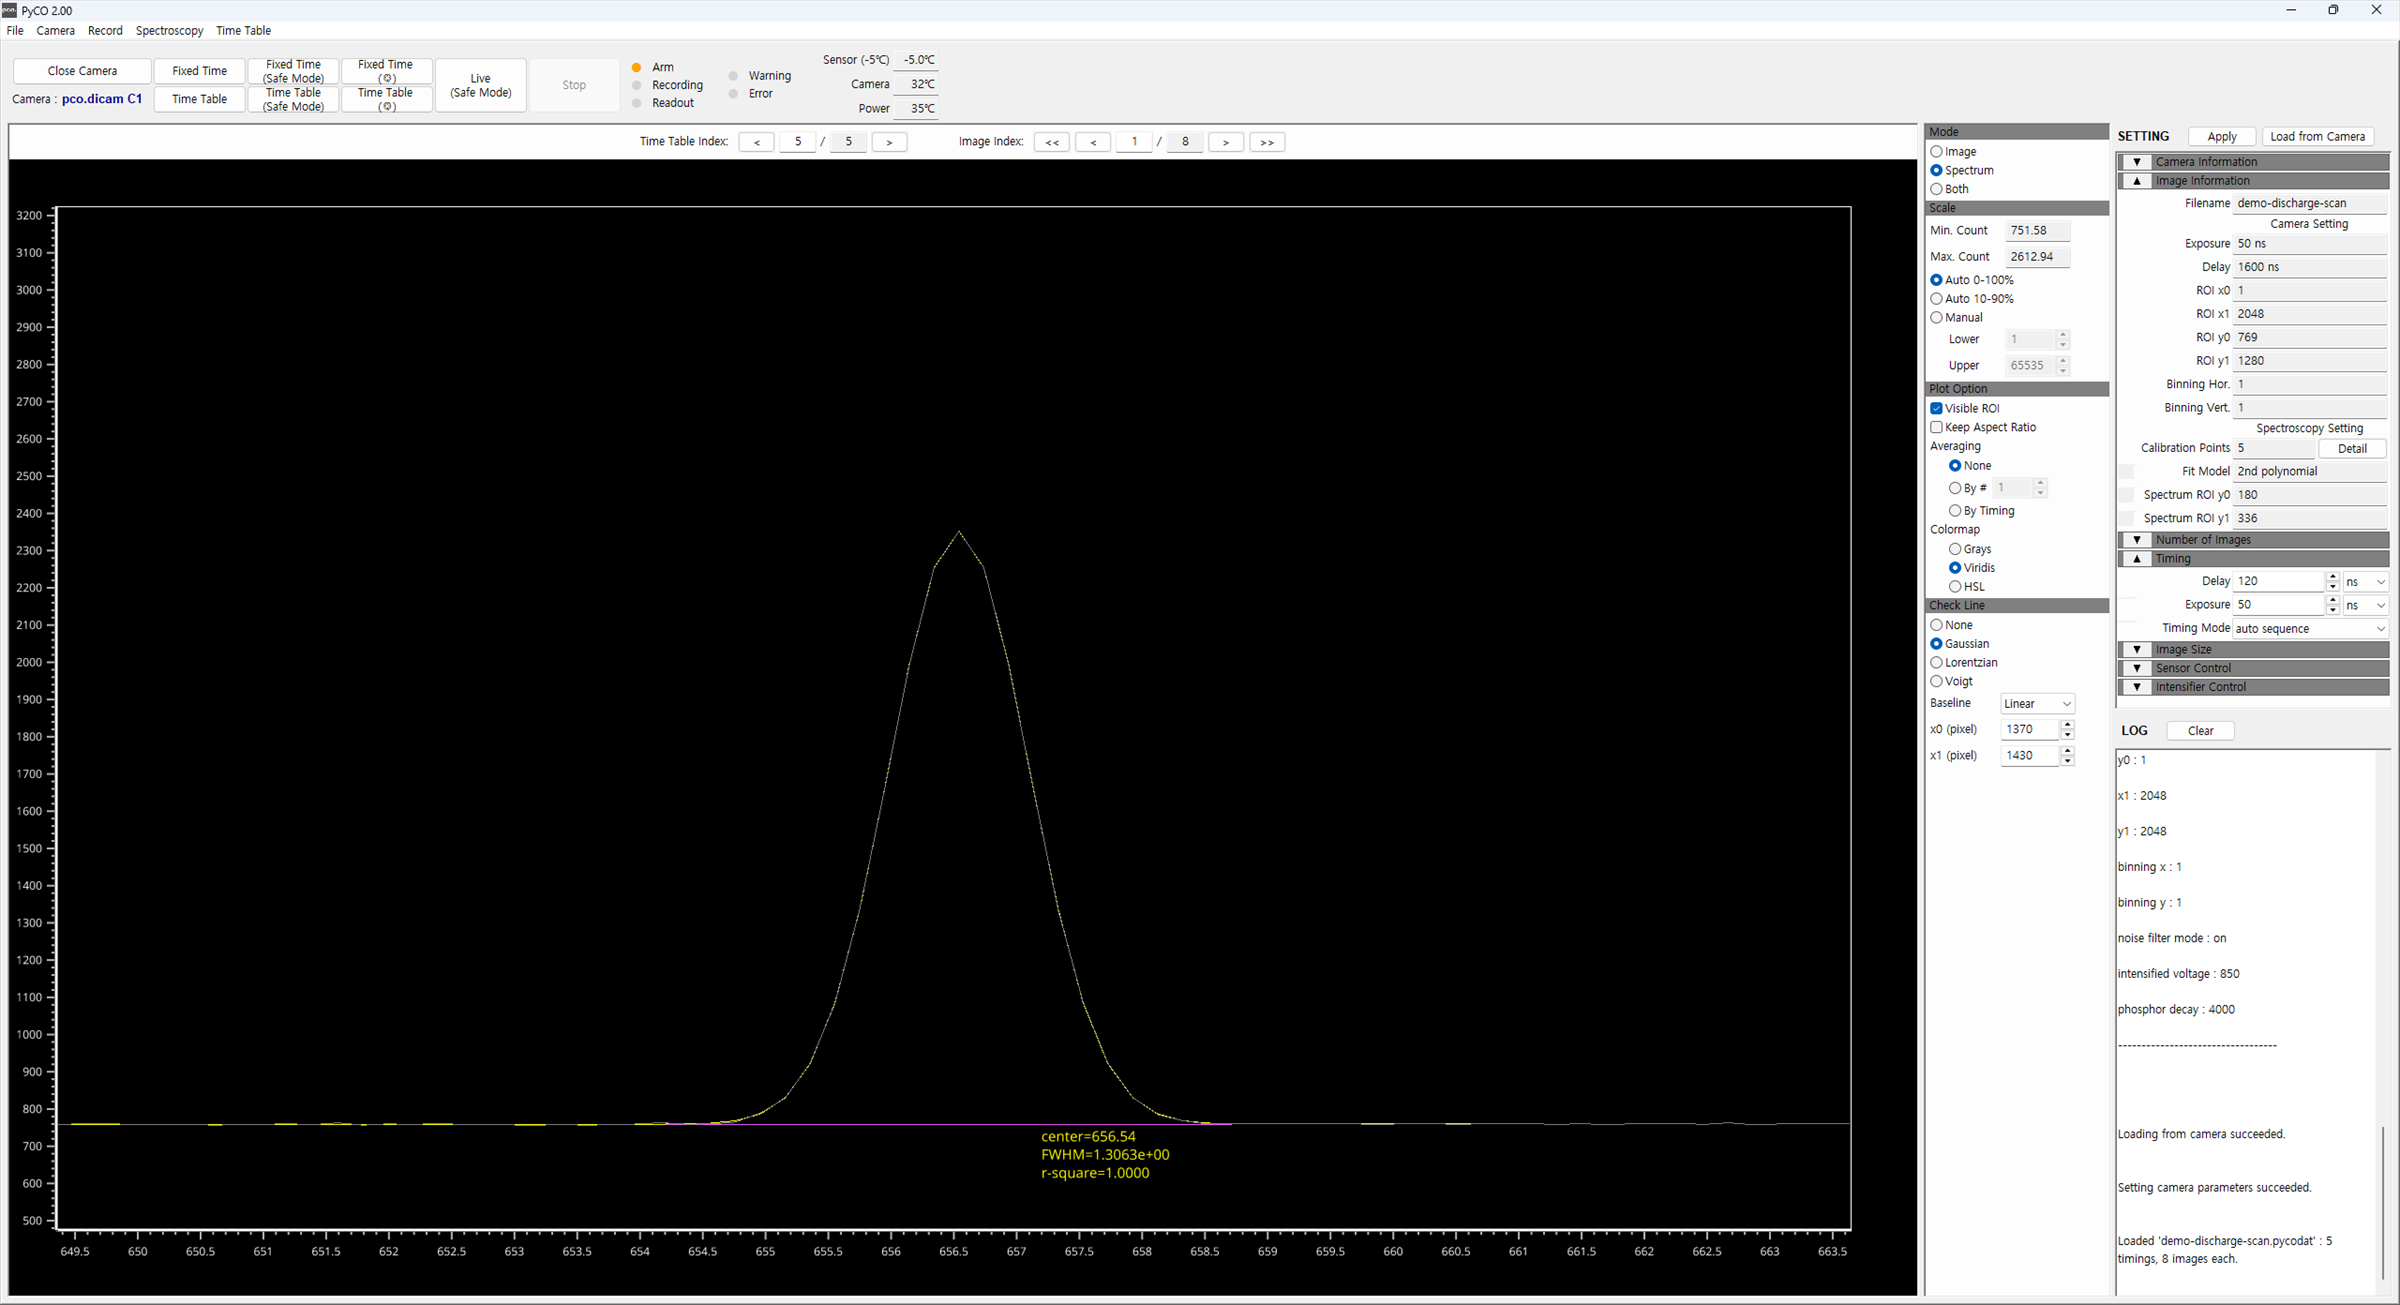
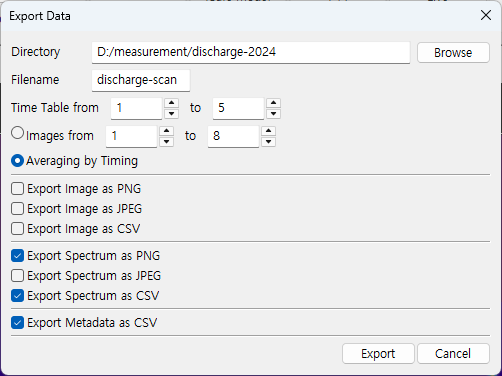
Selecting a span of the spectrum fits a Gaussian, Lorentzian or Voigt profile and reports centre wavelength, FWHM and coefficient of determination on the plot, over a baseline polynomial of first to fourth order. Images and spectra export as PNG, JPEG or CSV, and the measurement conditions as CSV.
System architecture
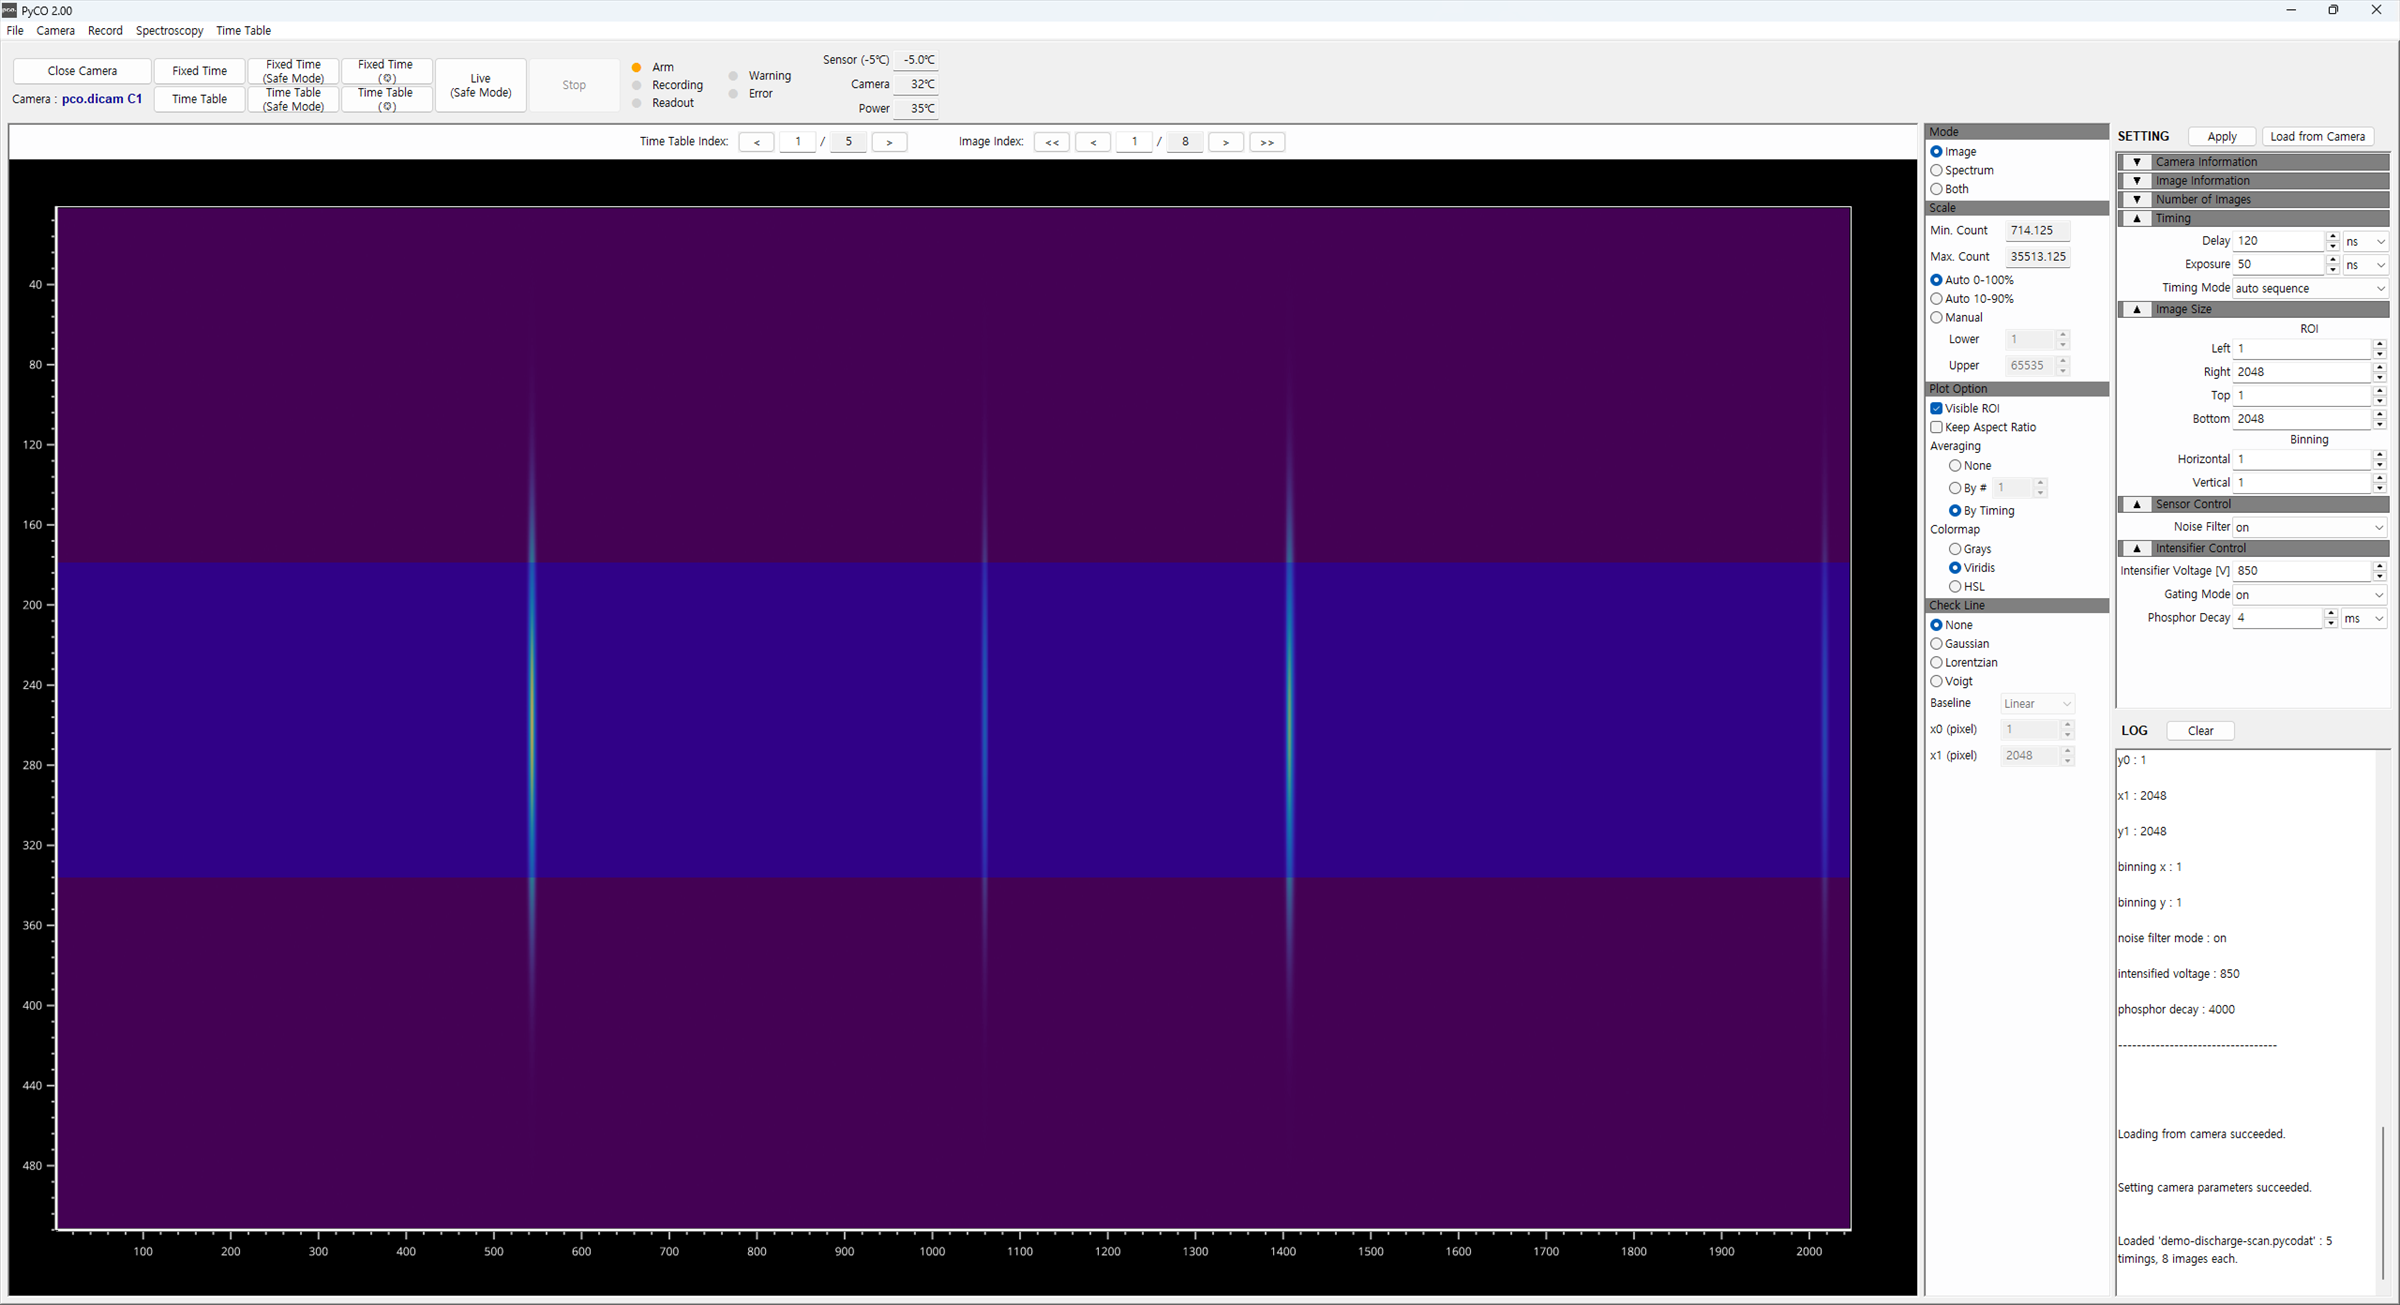
A single window divided into four panels by adjustable splitters.
- Top menu panel — capture mode buttons, camera status indicators, sensor, camera and power temperatures
- Figure panel — two VisPy canvases, one for the image and one for the spectrum, shown singly or together
- Settings panel — collapsible camera settings: camera information, image information, frame count, timing, image size, sensor control, intensifier control
- Log panel — camera descriptors, results of applied settings, capture progress, warnings and errors
Data moves through the program in this order.
- Scan — open the camera over the SDK and read its descriptor, then clamp every input's minimum, maximum and step to what the hardware actually accepts
- Apply — write the panel's values to the camera through SDK calls
- Record — buffer frames in the camera's memory, copy them to the host, and read back the settings in force at that moment
- Display — average the rows inside the ROI into a one-dimensional spectrum and map the horizontal axis to wavelength through the calibration fit
- Save and export — write frames and conditions into one file, or export a selected range as images and CSV
Implementation
Capture modes
Five modes cover the ways the camera is used. Fixed Time records a set number of frames at one timing. Time Table walks the list of timings. Each has a Safe Mode counterpart that records one frame at a time and inspects it, and Live keeps a rolling window of the most recent N frames.
Lucky mode builds on Safe Mode: a frame whose pixels all fall below a threshold is treated as empty and discarded. In experiments where emission happens sporadically, this keeps blank frames out of memory. The number skipped is reported alongside the frame count.
Long work and the interface
Capture status polling, camera health polling and multi-file loading each run on their own thread, with screen updates handed back to the UI thread through wx.CallAfter. Settings must not be touched mid-run, so the widgets are grouped and switched together across three states: no camera, ready, recording.
Reading hardware status
Camera health comes back as bit flags. Warning bits for supply voltage, supply temperature, board temperature, sensor temperature, external battery and offset regulation range, and error bits that add interface, RAM, mainboard and head board failures, are each decoded into a readable line in the log.
Image display
Scrolling through 16-bit frames of up to 2048×2048 needs more than ordinary drawing, so the canvases are GPU-backed through VisPy. Contrast scales automatically over the full range, automatically over the central 80%, or manually; colormaps are Grays, Viridis and HSL. Hovering reports the pixel index and value on the image, and the pixel index, wavelength and intensity on the spectrum.
Keeping settings
Spectroscopy settings and the timing list are saved to the user's documents folder and restored at the next start. Re-scanning the camera backs up whatever settings the hardware held, initialises it, then writes them back, so a scan does not discard the current configuration.
Result
A scan that used to be driven point by point now runs from a single list, leaving the operator to watch progress and camera status while it works.
The conditions behind a measurement no longer need to be written down separately. They travel inside the same file as the frames, so opening a file later shows the settings it was recorded with and makes the same capture repeatable.
Images that arrived in pixels are read as wavelength-calibrated spectra inside the program, fitted for centre wavelength and FWHM, and exported selectively. Measuring and looking at the result happen in one window.
Technology
- Python
- wxPython
- VisPy
- NumPy
- SciPy
- matplotlib
Screens
Have a project in mind?
Tell me about the problem and where things stand, and we can work out the right approach together.
Discuss a project