Engineering · 2022
Multi-Channel Acquisition and Monitoring for Combustion Testing
A desktop app that reads pressure, flow and temperature through NI CompactDAQ and derives combustion properties as the test runs
A desktop program that gathers the pressure, flow and temperature channels of a combustor test rig onto one screen and derives the quantities an operator needs to judge the operating point, such as equivalence ratio and laminar flame speed, while the test is running.
- Client
- Confidential client
- Category
- Engineering
Overview
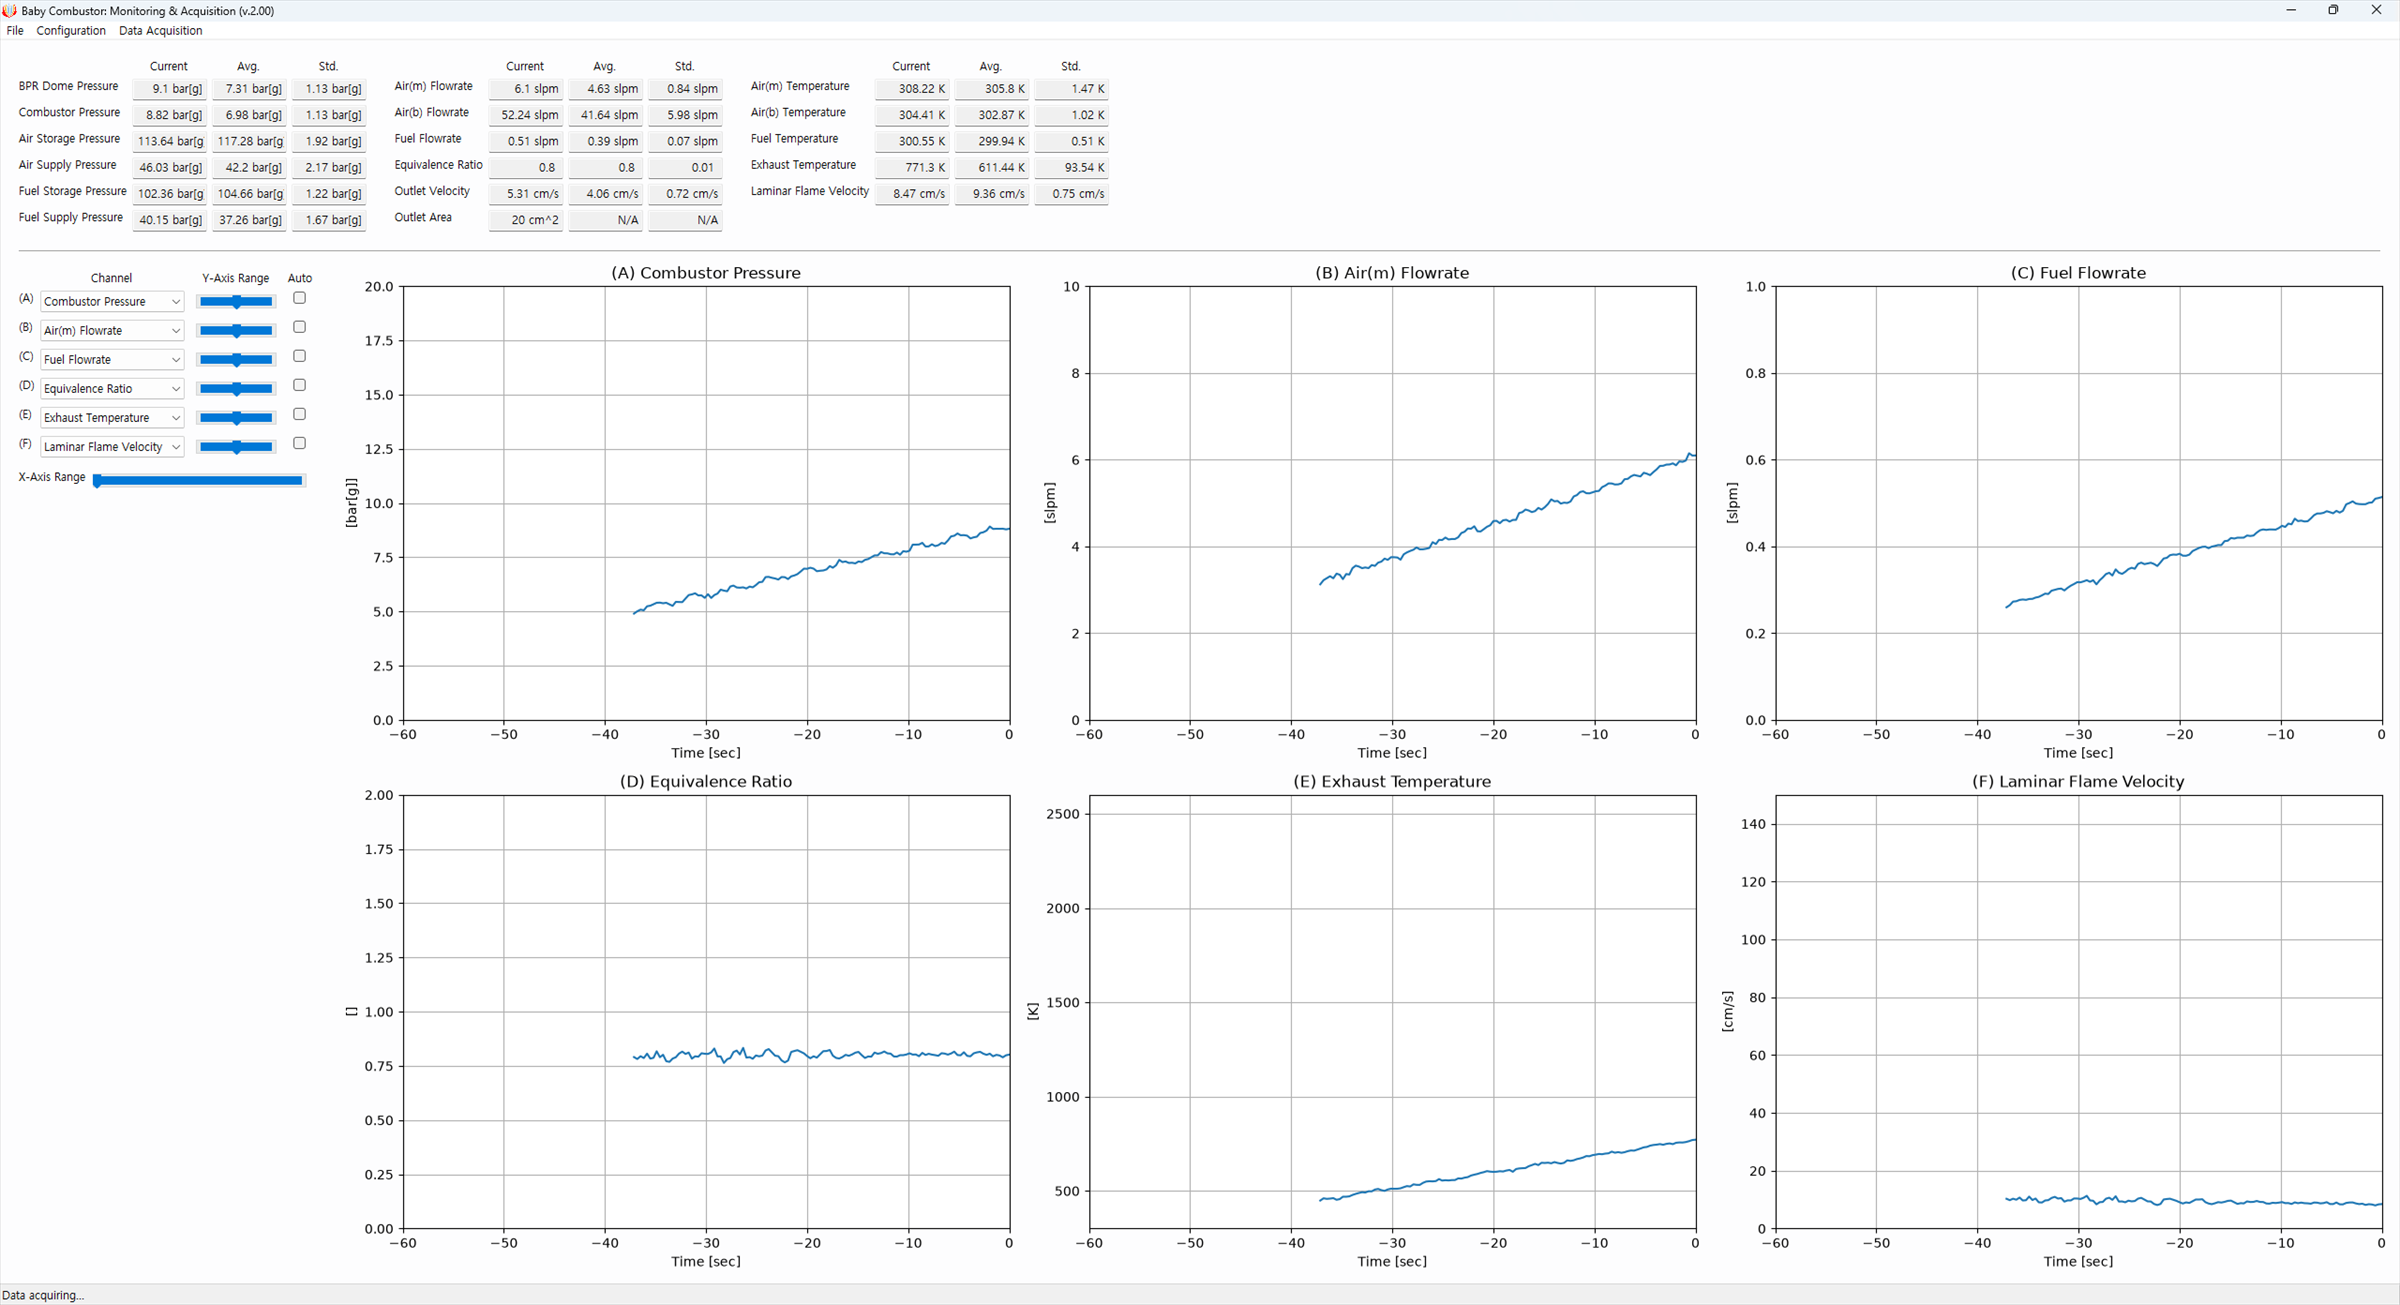
CMNA handles the instrumentation of an optically accessible high-pressure combustor test rig. It brings combustor pressure, the storage and supply pressures of air and fuel, three flow lines and four temperature points onto a single screen, and records the run to a file.
The program talks to an NI CompactDAQ chassis (cDAQ-9185) over Ethernet, reads its current input and thermocouple modules together, converts each sensor's current signal and unit into engineering values, and feeds the numeric table and the graphs at the same time. On top of the measured channels, it computes equivalence ratio, outlet velocity and laminar flame speed on every sample and treats them exactly like measured items.
Challenge
Combustion test rigs can be monitored using general-purpose DAQ software provided by equipment manufacturers. However, these solutions primarily focus on data acquisition and visualization, offering limited capabilities for evaluating actual experimental conditions.
Key combustion parameters, such as equivalence ratio and laminar flame speed, must be calculated based on the gas mixture composition and its thermodynamic state. Traditionally, this has required separate post-experiment data analysis, making it difficult to verify in real time whether the actual operating conditions match the intended experimental settings.
- Sensors differ in output. Pressure transducers and mass flow meters send 4 to 20 mA; thermocouples send tens of millivolts.
- Sensors differ in units. Pressure arrives in bar, kPa or psi, absolute or gauge; flow arrives in slpm, scfm, scfh or g/s.
- The back pressure regulator downstream is damaged if exhaust temperature passes its limit, so that value has to stay in view throughout a run.
- The set of connected sensors changes from one experiment to the next, and the program cannot be rewritten each time.
Solution
Measured and derived quantities share one screen rather than living in separate places. The table at the top shows the current value, the running average and the standard deviation of seventeen items, and six time-history graphs sit below it.
- Six pressures: regulator dome, combustor, and the storage and supply pressures of air and fuel
- Three flow rates: oxidizer air, diluent air and fuel
- Four temperatures: oxidizer air, diluent air, fuel and exhaust
- Four derived items: equivalence ratio, outlet velocity, outlet area and laminar flame speed
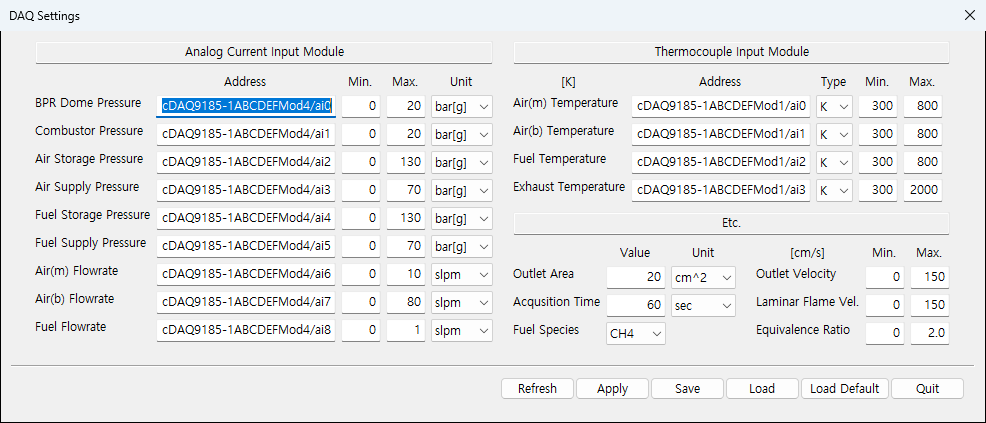
Each of the six graph panes can be pointed at any item. The Y-axis range is set with a slider that holds both ends at once, the mouse wheel widens or narrows that span, and a right click recentres it. A checkbox switches the pane to a range fitted to the data, and an X-axis slider zooms into the last few seconds of the acquisition window. The whole arrangement is meant to be workable with one hand while the rig is running.
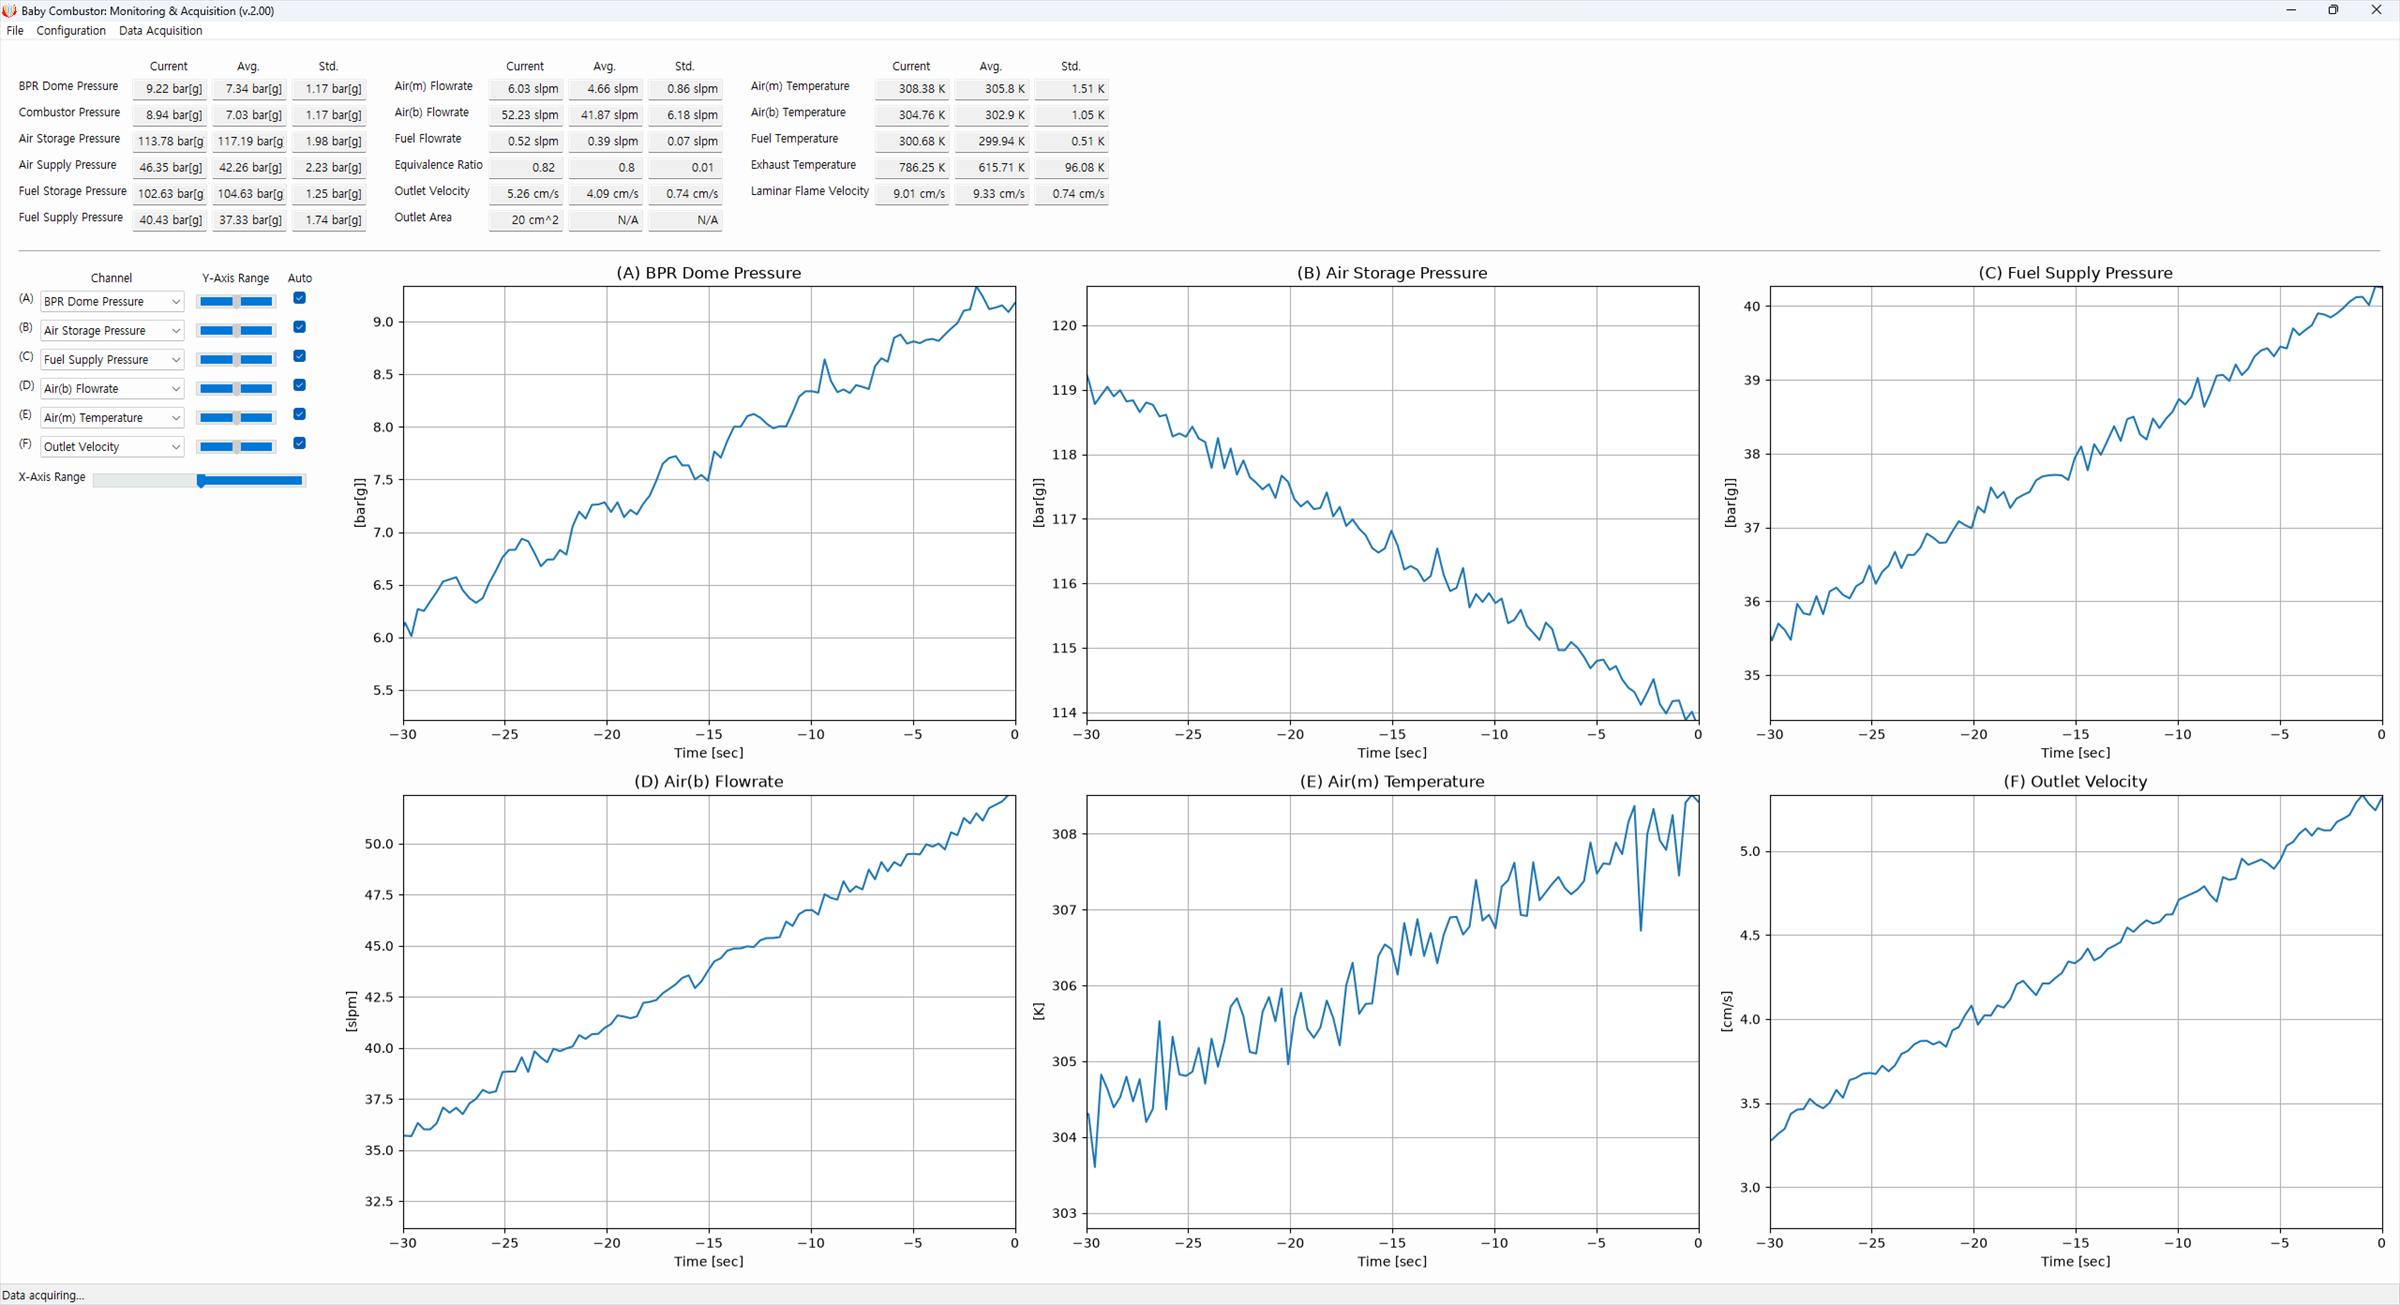
Channel configuration lives in a separate settings window. Each channel is given a module address, the sensor's measurement span and a unit, and thermocouple channels are given a type. An item with an empty address is treated as a sensor that is not connected for this run and is skipped. A whole configuration can be saved to a file and reloaded, so a change of rig layout is a change of settings rather than a change of code.
Acquired data is written out as CSV from the menu. Each row carries the item name and its unit ahead of the values, so the file alone says what units the numbers are in.
System architecture
Measurement rests on the NI CompactDAQ platform: an Ethernet chassis holding one module per signal type, so a change in the sensor set is a change of module rather than of instrument.
The NI hardware the program talks to
CMNA addresses one Ethernet chassis and the two input modules in it. The program reserves the chassis, then reads the channels of both modules as a single acquisition task.
- NI cDAQ-9185: four-slot, extended-temperature Ethernet CompactDAQ chassis, kept on the same subnet as the host PC and reserved over the network. Only two of the four slots are used; the rest are left free for other measurements.
- NI 9208 (slot 4): 16-channel, ±20 mA, 24-bit current input module, 500 S/s per channel, with 50/60 Hz rejection for immunity to mains noise. Six pressure transducers and three mass flow meters — nine channels in all — land here.
- NI 9212 (slot 1): eight-channel thermocouple input module, ±78 mV, 24-bit, 95 S/s per channel simultaneous, with an isothermal terminal block and channel-to-channel isolation, supporting types K, J, T, E, N, S, R and B. The four thermocouples on air, fuel and exhaust land here.
The output side, kept separate
The current signals driving the valves and the electronic pressure regulator are deliberately not on the measurement chassis, so that a stalled acquisition program can never be the reason fuel flow cannot be turned down. Output belongs to a second chassis and a dedicated program; CMNA has no part in it.
- NI cDAQ-9181: one-slot Ethernet CompactDAQ chassis
- NI 9266: eight-channel, 0 to 20 mA, 16-bit analog output module that holds its outputs at 0 mA on power-up and detects open loops.
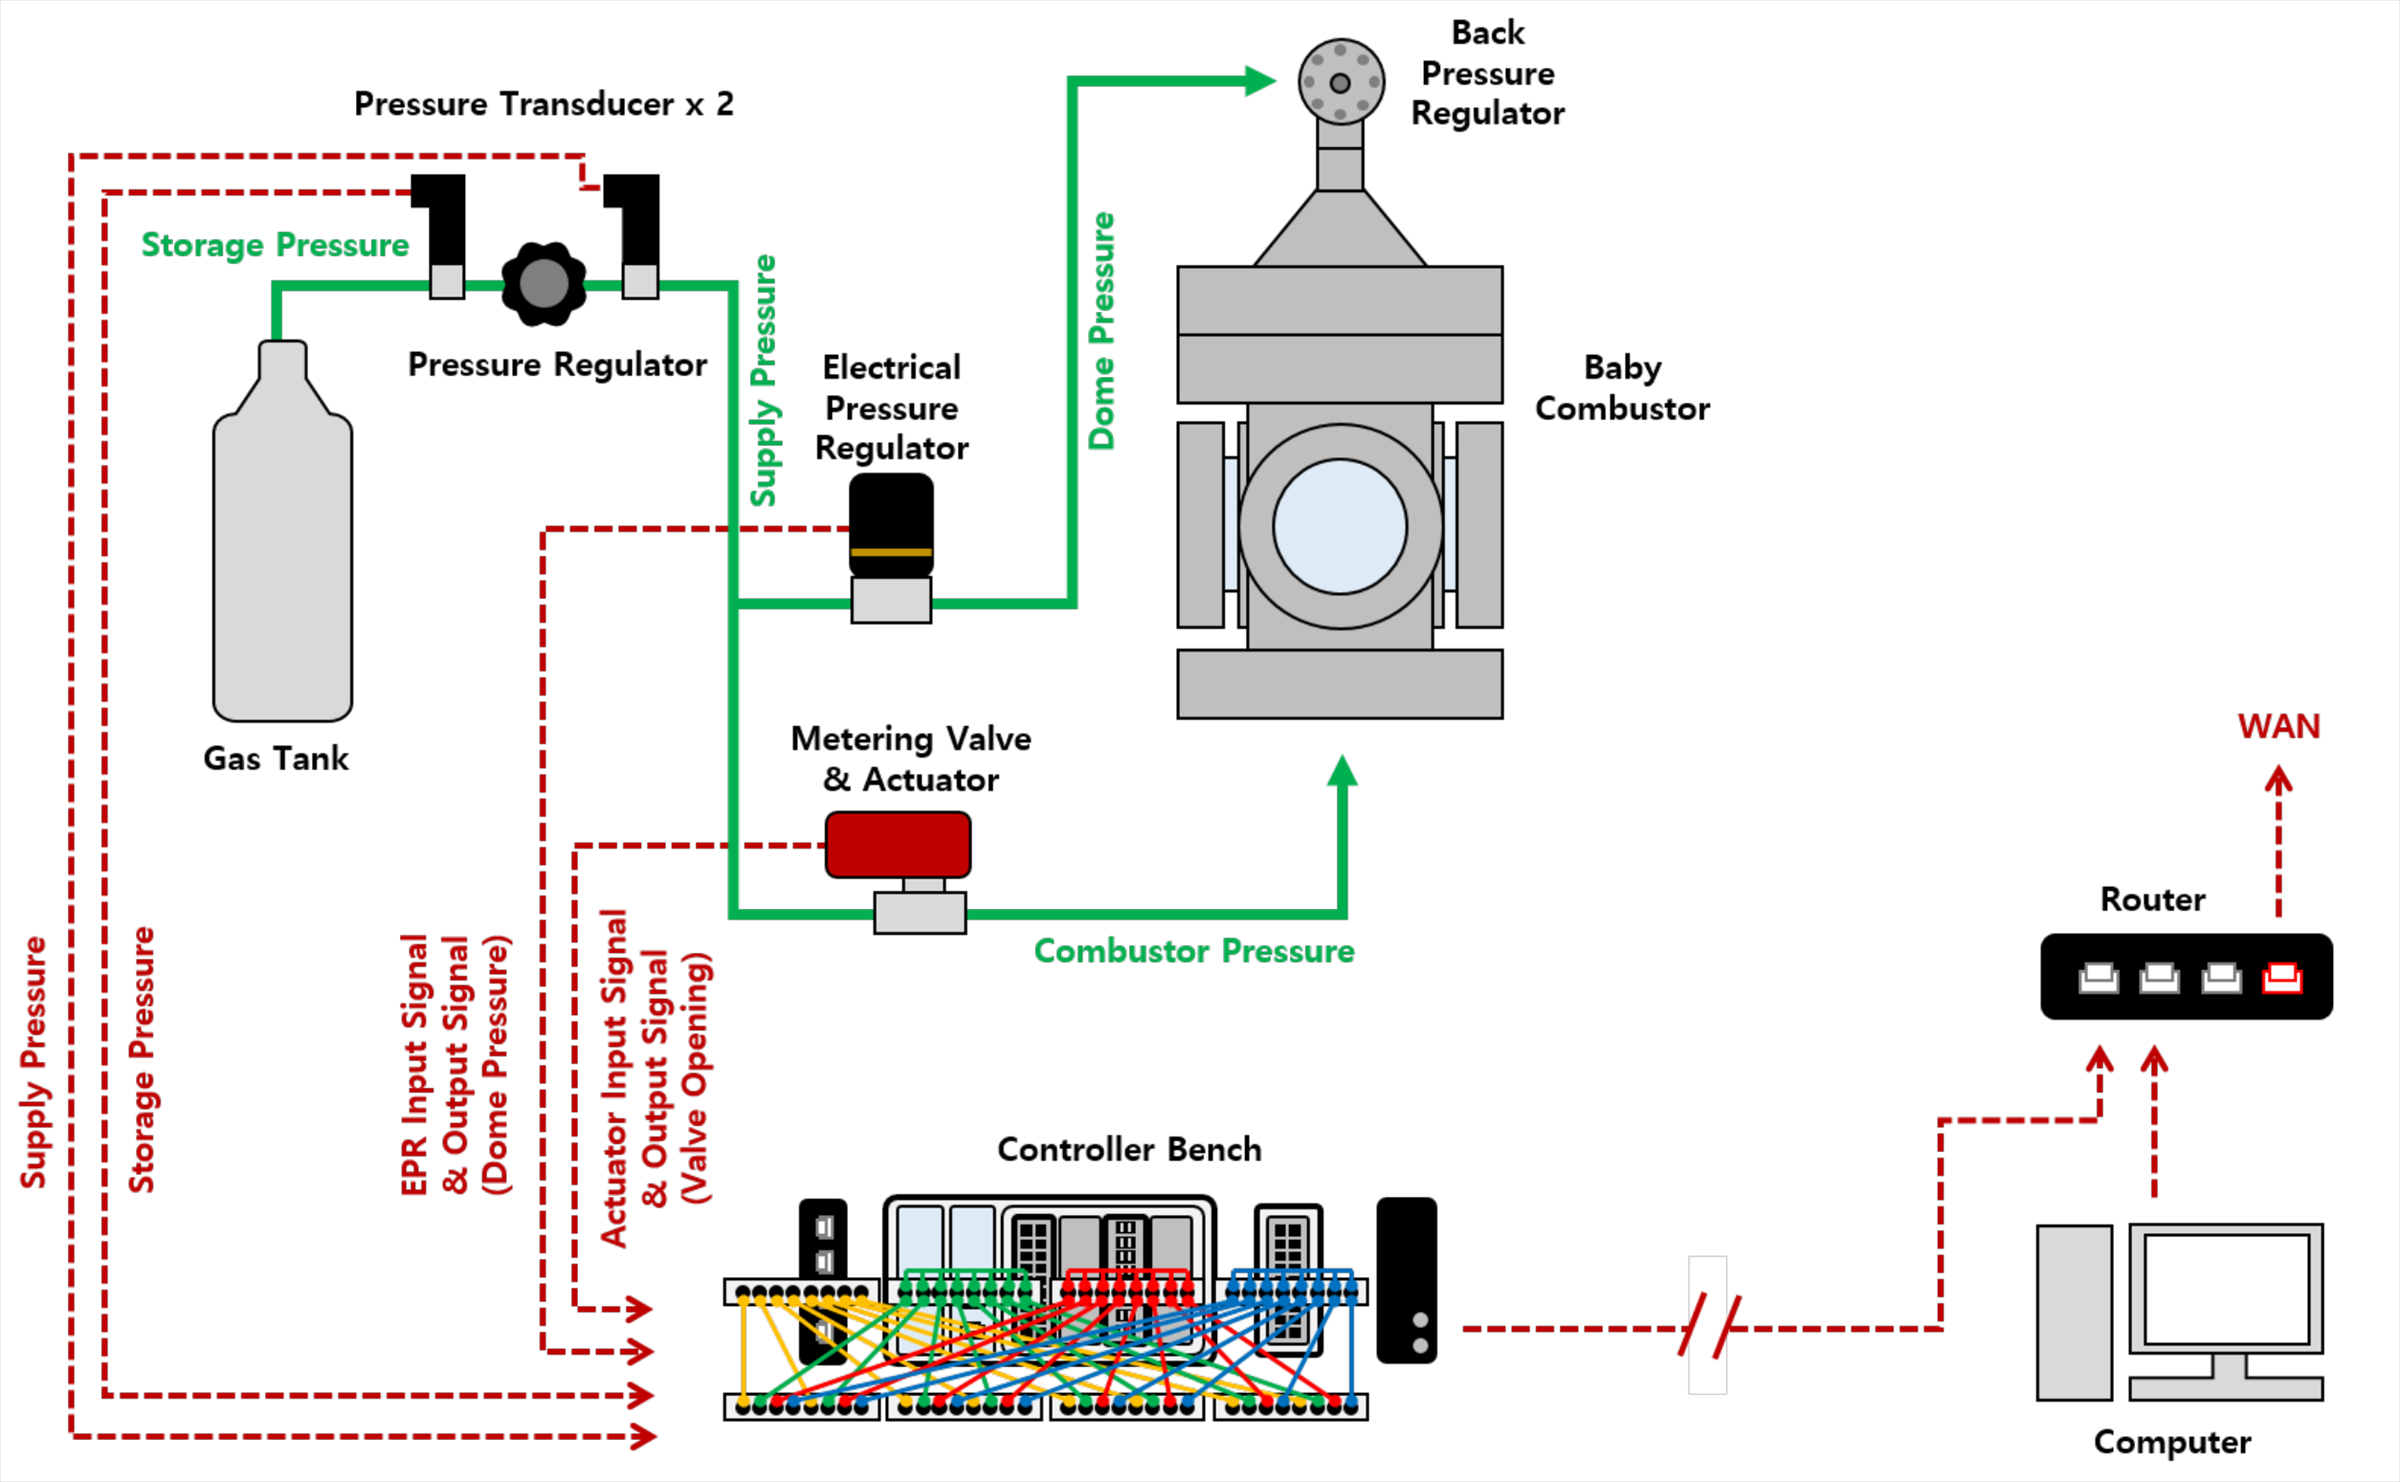
Both chassis and their modules sit on one controller bench along with the DC power supply, the Ethernet hub and the wire terminals. Every sensor line passes through a terminal block, where it picks up power, before reaching its module channel.
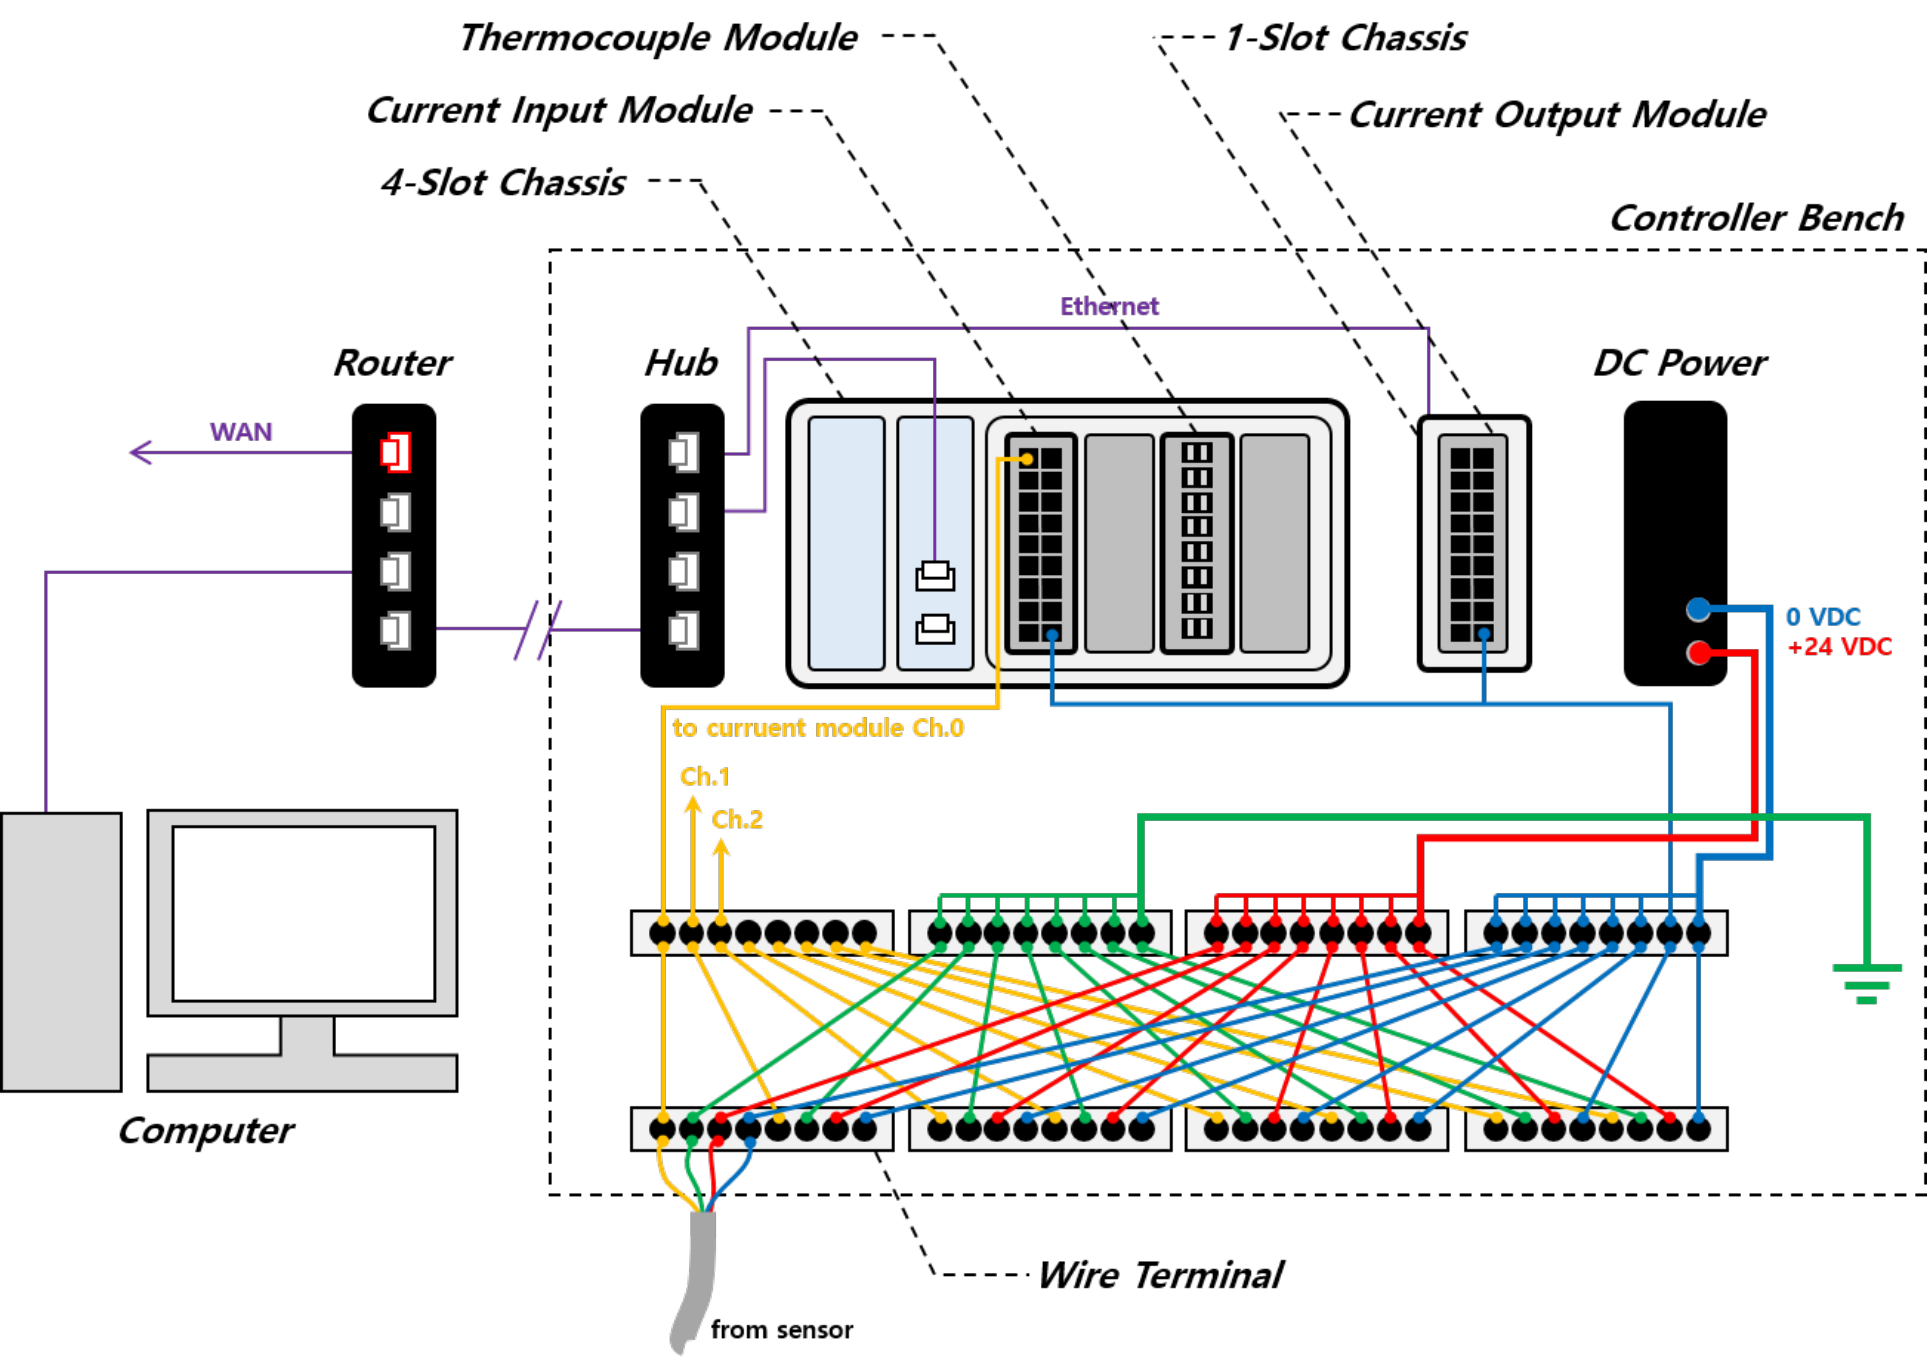
Equipment wired to the modules
- Bronkhorst EL-FLOW Select digital mass flow meters: methane 0.12 to 6 slm, air 1.2 to 60 slm and 9.6 to 480 slm, with 4 to 20 mA output and an accuracy of ±0.5% of reading plus ±0.1% of full scale.
- Hanbay MCJ/MCL-050AF-3 electric actuators mounted on Swagelok and Hoke metering valves, driven by a 4 to 20 mA signal and returning valve opening as feedback.
- Equilibar GS series dome-loaded back pressure regulator with a QB1 electronic pressure regulator, holding combustor pressure.
- Thermocouples and pressure transducers, wired to the input modules through a terminal block.
Data flow
- The program reserves the chassis and builds one acquisition task from the channels that have an address.
- A continuous 10 Hz sample clock drives the loop; each tick reads the current channels and the thermocouple channels.
- Current readings become engineering values, then are converted again into internal standard units for computation.
- Equivalence ratio, mixture state, laminar flame speed and outlet velocity are derived from those values.
- Values accumulate in a rolling window the length of the configured acquisition time, and the table and graphs are refreshed.
Implementation
Building the NI-DAQmx task
Only channels with a non-empty address are gathered into a single task. An item whose name carries a temperature is registered as a thermocouple channel and everything else as a current channel, so two kinds of signal sitting in different modules come back together on one read. Channel addresses are the physical channel names as NI MAX reports them, and the sample clock is set to 10 Hz in continuous mode. A sensor that is not connected drops out of the task simply by having no address, so the same code runs whatever the channel count is for a given experiment.
Current conversion and invalid readings
Each 4 to 20 mA channel is mapped linearly onto the span configured for that sensor. A reading below 4 mA means a broken wire or an unpowered sensor, and converting it directly would yield a physically impossible negative value. That band is caught separately and recorded as an invalid marker, so a disconnected channel does not distort the graphs.
Internal standard units
The units shown on screen are separated from the units used in computation. The operator picks whichever of bar, kPa, psi, slpm, scfm or g/s is familiar, and the program converts incoming values into one set of standard units — Pa, K, cm/s, cm³/s — before computing. The absolute-versus-gauge distinction is absorbed at the same step. A change of display unit therefore never reaches the equations.
Derived combustion properties
Equivalence ratio comes from the volumetric flow ratio of air to fuel, weighted by the carbon and hydrogen atom counts of the fuel molecule. Cantera supplies those counts from the fuel species name, so switching from methane to propane needs no edited coefficients.
Laminar flame speed uses a published correlation, but the mixture temperature and pressure it needs are established with Cantera first. The enthalpies of air and fuel are averaged by flow rate to fix the mixture state, and the resulting temperature, together with combustor pressure, goes into the correlation. Densities from the GRI 3.0 mechanism serve the outlet velocity calculation as well.
Acquisition loop and interface
Acquisition runs on its own thread, and while it runs the settings and save menus are locked so that the task cannot be reconfigured underneath it. Values live in a rolling window the length of the configured acquisition time, so memory stays flat over a long run and the graphs always show the recent stretch.
Result
Seeing equivalence ratio and laminar flame speed during a run moved the question of whether a set point matched the intended condition from after the experiment into the experiment itself, and cut down on runs repeated only to hit the right condition.
Because sensor layout and units are configuration rather than code, a change to the rig became a change of settings file. A saved configuration and its CSV record stay together, so it remains possible afterwards to tell which channel layout and which units a data set came from.
The program was written for one combustor, but since every channel and unit is configurable the same build suits any rig that watches pressure, flow and temperature together. Later versions added a virtual flow meter that infers flow rate from metering valve opening and upstream pressure, along with a valve opening monitor, and the system layout and operating procedure were written up in a separate manual.
Technology
- Python
- wxPython
- matplotlib
- NumPy
- NI-DAQmx
- Cantera
Screens
Have a project in mind?
Tell me about the problem and where things stand, and we can work out the right approach together.
Discuss a project