Engineering · 2024
Simultaneous Permittivity and Temperature Acquisition
A desktop program that drives an LCR meter and a thermal camera together, recording dielectric properties and specimen temperature on one time axis
An LCR meter and a thermal camera that run on their own, unsynchronised cycles are acquired together in a single program, so permittivity and specimen temperature can be followed on one time axis and exported as CSV.
- Client
- KAIST
- Category
- Engineering
Overview
A desktop program for dielectric testing in a university research lab. It reads capacitance (Cp) and dissipation factor (D) from a Keysight E4980A LCR meter while acquiring specimen surface temperature from a FLIR A35 thermal camera.
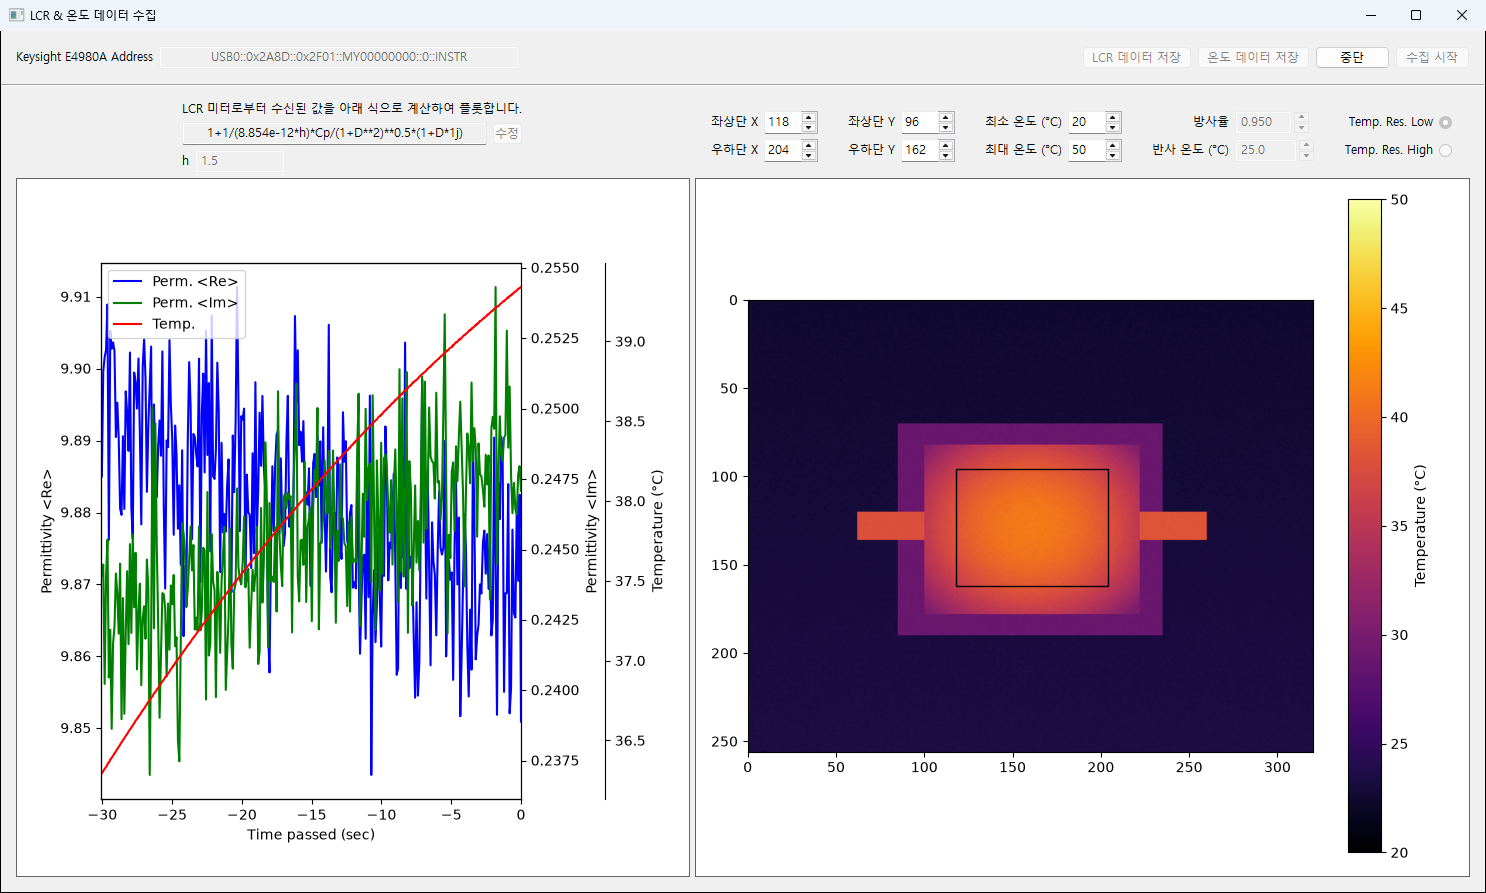
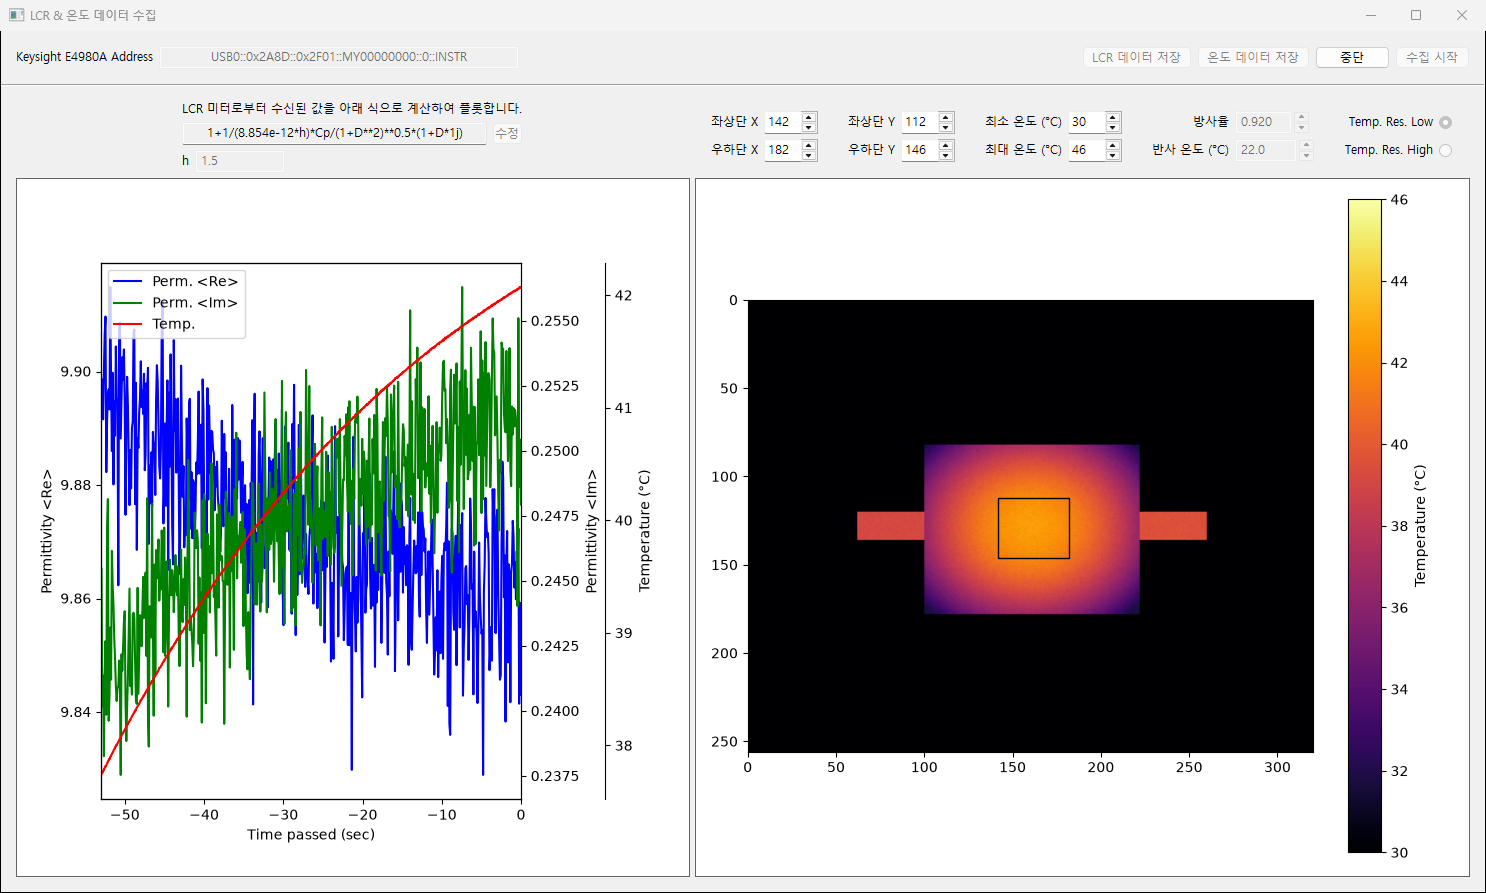
During a run, the real and imaginary parts of the complex permittivity computed from the LCR readings are plotted together with the average temperature of a selected region of the thermal image, all on a single time axis. The thermal image itself is displayed live, with the measurement region and a temperature colour bar.
When the run ends, the LCR data and the temperature data are each exported as CSV.
Challenge
The two instruments come from different vendors and are driven in different ways. The LCR meter is reached over USB through VISA and read from its measurement buffer; the camera is configured and read through the node map of the Spinnaker SDK.
Their acquisition rates differ as well. The camera delivers thirty frames per second, while a single LCR measurement takes considerably longer. The instruments are not synchronised with each other, so waiting on one must not cost data from the other.
Obtaining temperature values from the camera requires the pixel format, temperature linear mode, temperature resolution, emissivity and reflected temperature to be set correctly. These depend on the specimen and the test conditions, so they had to be adjustable from the program.
Solution
- Each instrument has its own acquisition thread and reads at its own pace. A separate thread handles redrawing, so the graph and the thermal view update whenever either side produces new data.
- A rectangular region drawn over the thermal image defines the area whose average value is used as the temperature. The region can be adjusted while acquisition is running and is outlined on screen.
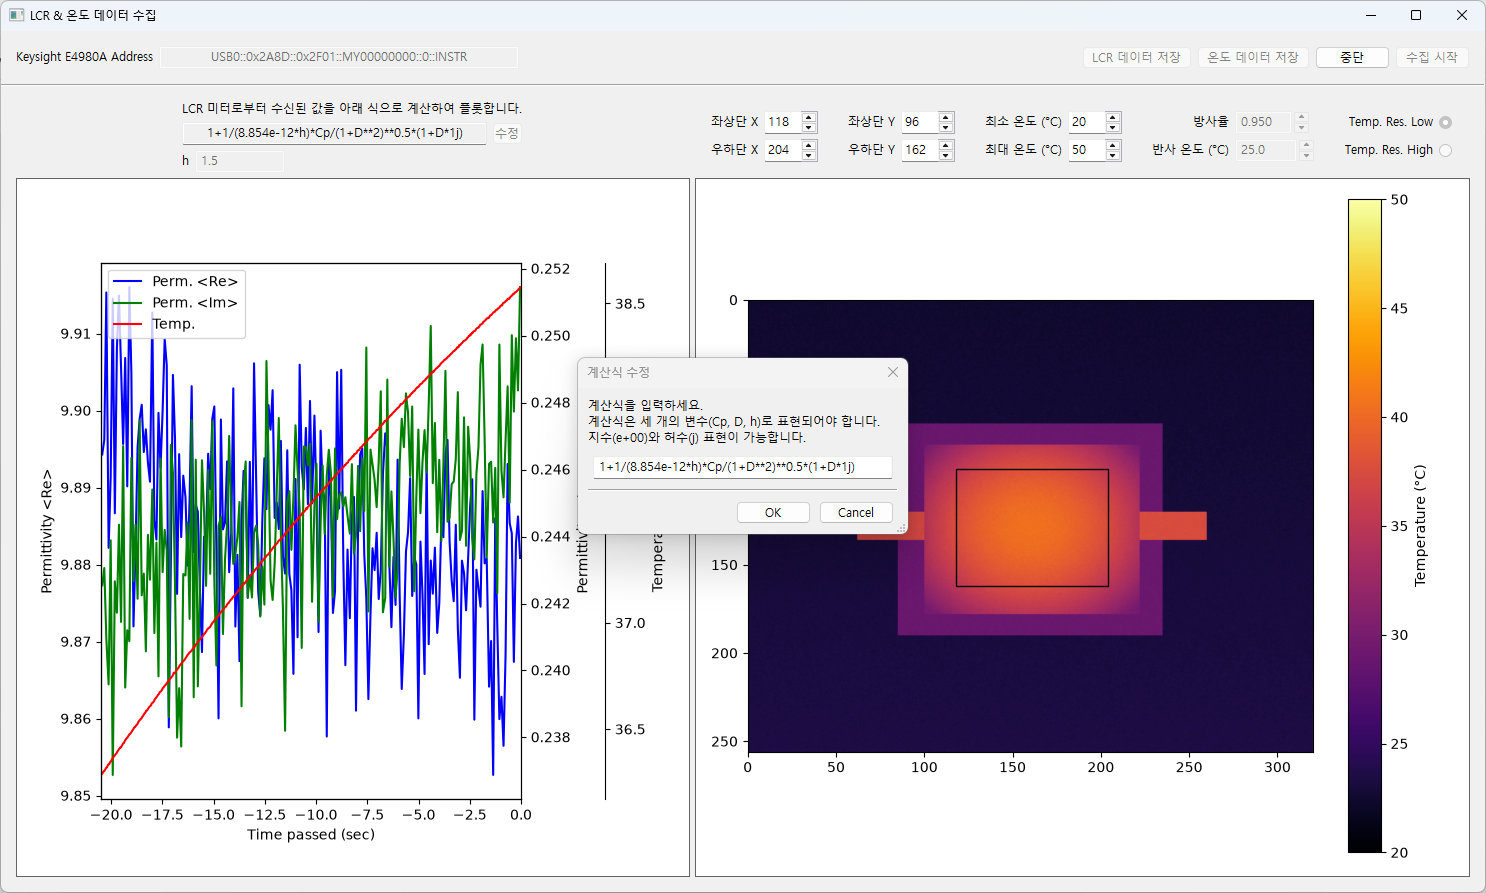
- The permittivity formula can be edited in the UI, so an equation or constant that changes with specimen geometry does not require a code change.
- Emissivity, reflected temperature, temperature resolution and the colour map range are set in the UI. Settings are saved on exit and restored on the next run.
System architecture
Components
Data flow
- One acquisition thread reads Cp and D from the LCR buffer and evaluates the formula to obtain the complex permittivity.
- A second acquisition thread converts each camera frame into a Celsius array and averages the selected region.
- Both values are appended, with their arrival time, to fixed-length buffers.
- The update thread periodically reads those buffers and redraws the graph and the thermal image.
Implementation
Because the formula is entered by hand, it is first checked with a regular expression that admits only the permitted characters. It is then converted into a function and evaluated once with test values; only a formula that passes is used for acquisition.
Camera frames arrive as raw 14-bit values. They are multiplied by the factor matching the selected temperature resolution and offset by absolute zero to give degrees Celsius. Emissivity and reflected temperature are written to the camera nodes when the connection opens, so the correction is applied on the instrument side.
Instrument communication is bounded by timeouts in case a device stops responding. An error during acquisition stops the run, releases both instruments and reports the cause in a dialog. On exit, the program waits for the acquisition threads to finish before closing.
The temperature CSV records the region coordinates, emissivity and reflected temperature alongside each measurement, so the conditions behind a given value can be checked afterwards.
Result
A run is started from a single screen, and permittivity and specimen temperature can be followed together while the test proceeds. Because both are recorded on the same time axis, the two instruments' data do not have to be aligned after the fact.
The region coordinates and camera correction values are stored with the measurements, so the conditions behind a data set remain identifiable. Test settings persist between runs.
Points found in actual use were addressed in later revisions: selectable temperature resolution, region definition, the orientation of the thermal view, and the complex representation of permittivity.
Technology
- Python
- wxPython
- NumPy
- matplotlib
- PyVISA
- Spinnaker SDK
Screens
Have a project in mind?
Tell me about the problem and where things stand, and we can work out the right approach together.
Discuss a project