Engineering · 2024
Structural Displacement Monitoring Desktop App
Reads a monitoring database and evaluates building tilt and inter-story drift angle
Replaced the manual work of pulling displacement data out of a monitoring database and computing it by hand with a resident desktop app that reads each new measurement cycle, derives tilt and inter-story drift angle, and grades them against fixed criteria.
- Client
- Chosun University
- Category
- Engineering
Overview
A building monitoring system measures displacement at each survey point and records it continuously in a Microsoft SQL Server database. What the database holds, though, is only per-point displacement (dN, dE, dH) and elevation. Judging the current state of the building meant pulling those values out, grouping them by floor and column, and converting them into structural safety indicators.
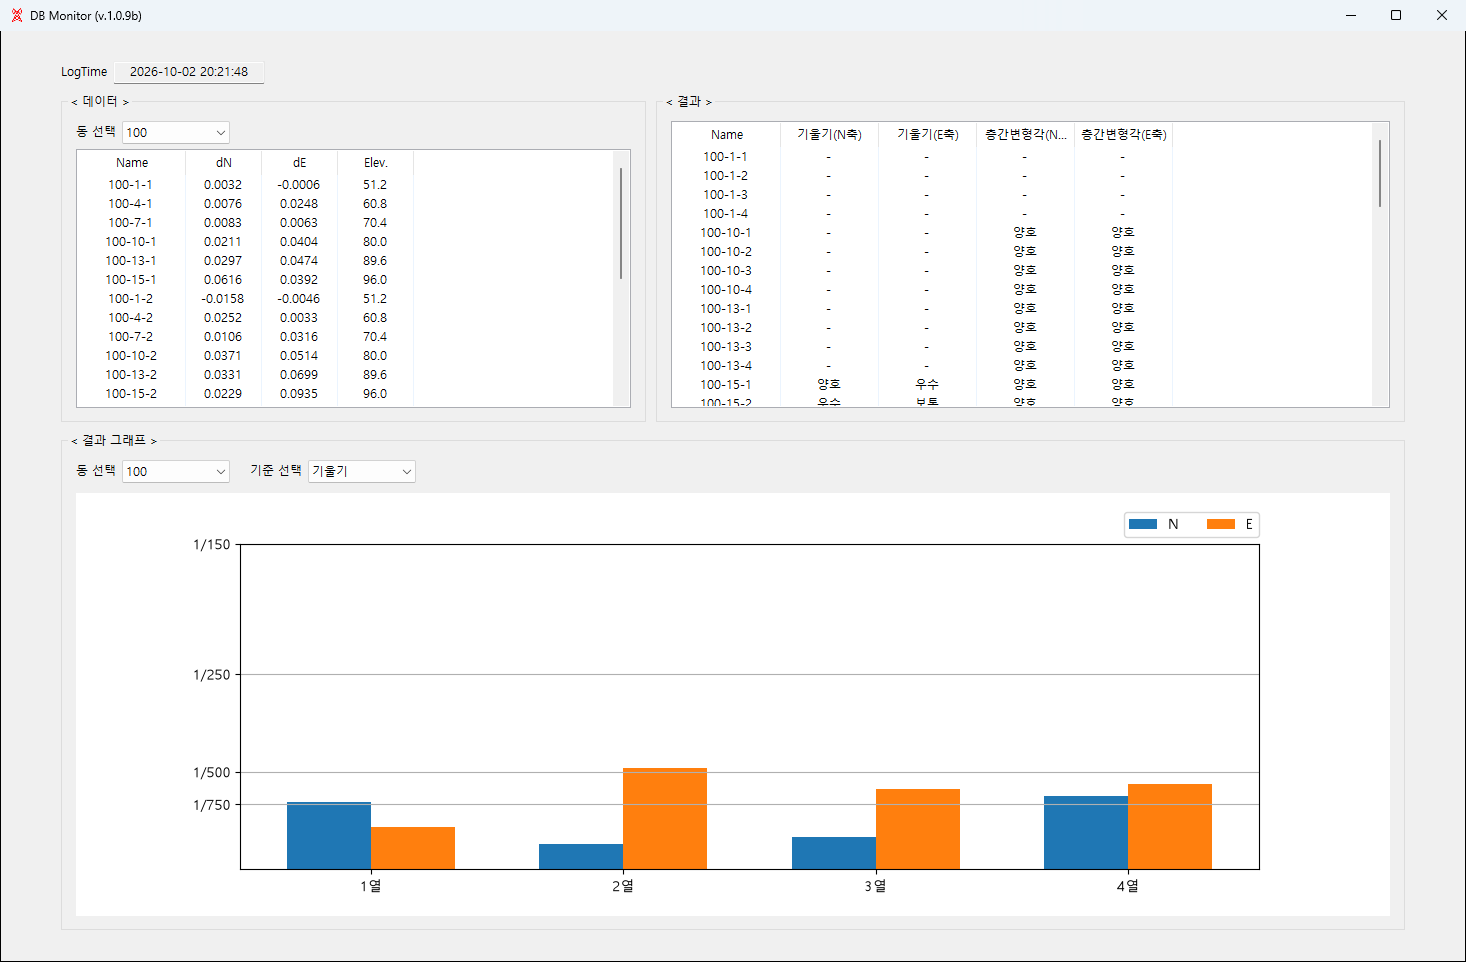
This Windows desktop application does that work. It connects to the database, reads the most recent measurement cycle, parses building, floor and column from each point name, computes tilt and inter-story drift angle, grades the results against fixed criteria, and presents them as tables and charts. A research team at Chosun University uses it to keep an eye on measurement results.
Closing the window sends the app to the system tray instead of quitting, so it can stay running for as long as measurement continues.
Challenge
The monitoring database is built to store measurements, not to answer questions about structural safety.
- Displacement and elevation live in three separate tables, and those tables are not written on a synchronized schedule.
- Each table marks measurement cycles differently. Rows in the displacement table share an EventTime per cycle, while the point information table carries no cycle marker at all.
- A point's location exists only inside its name string, so the building, floor and column have to be parsed out of it.
- Neither tilt nor inter-story drift angle can be derived from a single point. Each requires pairing a point with the one below it, or with the lowest point in the same column.
The result was a manual cycle of exporting data, arranging it in a spreadsheet and applying formulas, which meant changes only surfaced when someone sat down to look.
Solution
Database reading, evaluation, display and alerting are handled in one program.
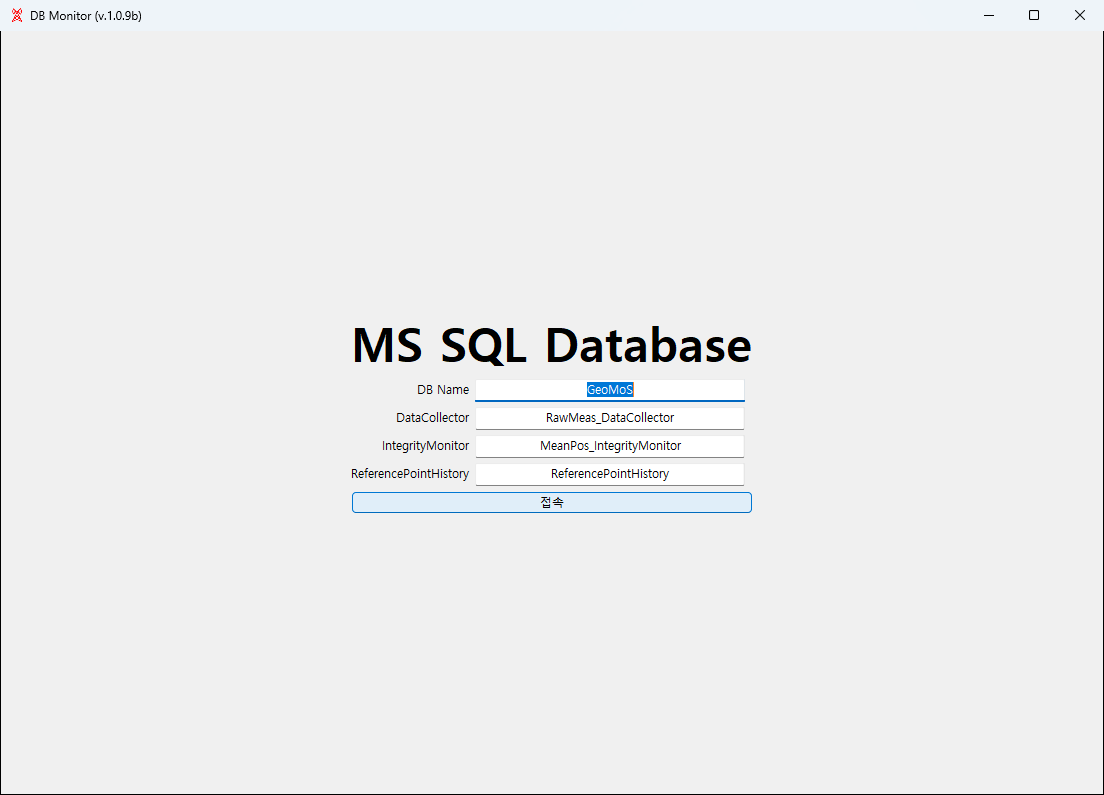
- The first screen takes the database name and the three table names. On connect, the app verifies that those tables and their required columns exist and reports exactly what is missing. Connection settings are saved and restored on the next launch.
- Once connected, the app polls for the latest measurement cycle on a fixed interval. If the timestamp matches the one already loaded, the screen is left alone, so it reacts only to genuinely new data.
- Point names are parsed into building, floor and column. Inter-story drift angle is computed against the nearest point below in the same column; tilt is computed between the topmost and lowest points of that column.
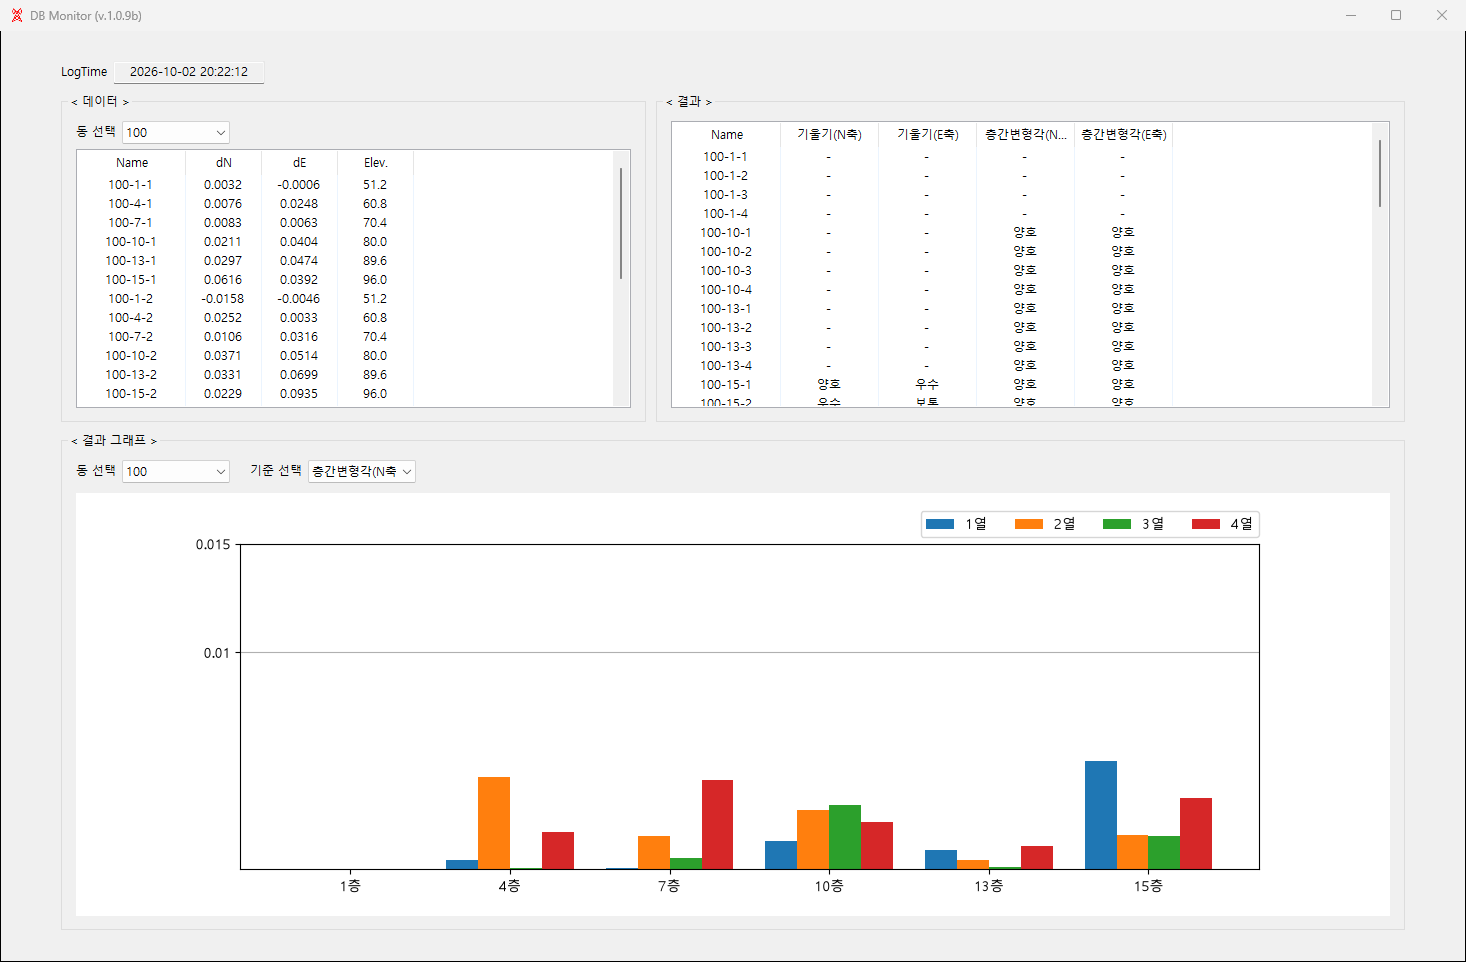
- Computed values are converted into grades. Drift angle is graded as good, moderate or dangerous; tilt across five levels from excellent to poor. Rows graded dangerous are shown in red, and values in the warning or danger range raise a dialog.
- Results can be charted as bar graphs by building and by criterion, with the grading thresholds drawn as reference lines so each column's position is immediately visible.
- Table contents can be selected and copied, and every cycle's computed results are written to a tab-separated text file for later review.
System architecture
Components
reader: connects to the database and queries it, returning the latest cycle organized per survey point.ui: builds the connection screen, the monitoring screen and the tray icon, post-processes the data and drives the tables and charts.config: stores connection settings as JSON and writes per-cycle results to text files.log: records program events and errors to a rotating log file.
Data flow
- Find the most recent EventTime in the displacement table and read dN, dE and dH for every point sharing it.
- Read the point number to point name mapping from the point information table, and per-point elevation from the reference point history table.
- Merge the three results by point number, parse each name into building, floor and column, and sort by building, floor and column.
- Skip any point whose name does not match the expected format or whose displacement or elevation is missing.
- Walk the sorted points to compute inter-story drift angle and tilt, then grade each against the criteria.
Implementation
The quirks of working directly against the monitoring database are absorbed in the read layer.
- For tables without a cycle marker, the app queries only as many recent rows as the point count in the displacement table implies. The reference point history table, which is not time-synchronized, is queried more broadly and then reduced to the most recent value per point.
- Korean text can come back from the database with a broken encoding, so string values are re-decoded as they are read.
- Record timestamps are adjusted to local time before being displayed.
- Database queries run on a separate thread so the interface stays responsive while a query is in flight, and screen updates are applied as a single batch.
- Cases where a value cannot be derived, such as a missing point below or a point that is not the topmost in its column, are shown as blank rather than zero. Errors during a query or post-processing are reported and return the app to the connection screen.
Result
Reading measurement results no longer requires exporting data and arranging it by hand. With the program running, grades per building, floor and column refresh as each new cycle arrives, and values beyond the thresholds are visible on screen as soon as they appear.
Because the grading criteria are fixed in the program, everyone looking at the screen sees results computed the same way. Each cycle's output is written to a file, so the state at a given point in time can be reviewed later.
Technology
- Python
- wxPython
- matplotlib
- NumPy
- Microsoft SQL Server
- pymssql
Screens
Have a project in mind?
Tell me about the problem and where things stand, and we can work out the right approach together.
Discuss a project