Data · 2024
Clinical Data Quality Evaluation Desktop Application
Seventeen independently developed quality analysis modules integrated into a single Windows application
Seventeen clinical data quality analysis modules, each developed separately by a different researcher, were integrated into one desktop application with a single input format, a single run procedure and a consistent result view, so that running every metric takes two CSV files and no Python environment.
- Client
- Yonsei University
- Category
- Data
Overview
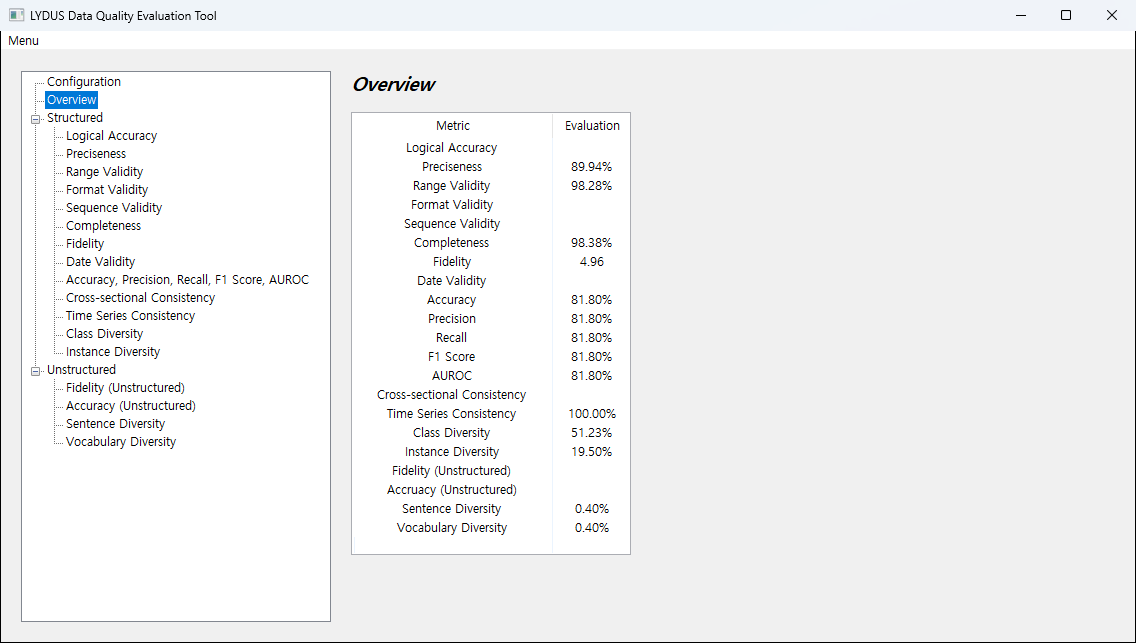
LYDUS is a Windows desktop application for checking whether clinical data is fit to use before it goes into research or analysis. It computes 17 quality metrics in all — 13 for structured data and 4 for free-text records — and presents the results on screen and as exported files.
The analysis logic behind those metrics was written by researchers, each working on their own metric. Different people owned different metrics, and the approaches range from plain statistics through machine learning models to language model judgements. This project was the work of binding those separately built modules into an application with one input format, one run procedure and one way of presenting results.
Two input tables provide the common ground. The QUIQ table is a long-format table in which each observation is one row, with 16 fixed columns covering the patient number, variable name, value, record time, unit, recorder and ground truth. The VIA table is a dictionary describing what each variable means. Source schemas differ between institutions, but once data is converted into these two shapes all 17 modules receive the same thing.
Challenge
The modules were written independently, and several things did not line up when they were brought together.
- Every module returns a different shape. One returns a single data frame; another returns a tuple of two data frames plus five weighted averages; others add dictionaries keyed by variable name. There was no common result type.
- They read the same input under different names. Some modules rename the incoming table's columns to whatever their own code expects before computing, so the same column goes by different names depending on the module.
- They report progress in their own ways. Some print straight to standard output, some use a progress bar, and some report nothing at all.
- None of them were written to be cancelled. Used as analysis scripts they simply ran to completion, so there was no path for stopping partway.
- Running times and failure modes differ. The statistical metrics process tens of thousands of rows immediately, while the language-model metrics call an API per record, take minutes, and can fail on a network or key problem.
Running any of them also meant having a Python environment and knowing each script's arguments and execution order. The reason for integrating them was that the people who needed to check data quality were not the people who had written the modules.
Solution
Rather than rewriting the modules, they were left to focus on computation, with a shared runner and result view built above them.
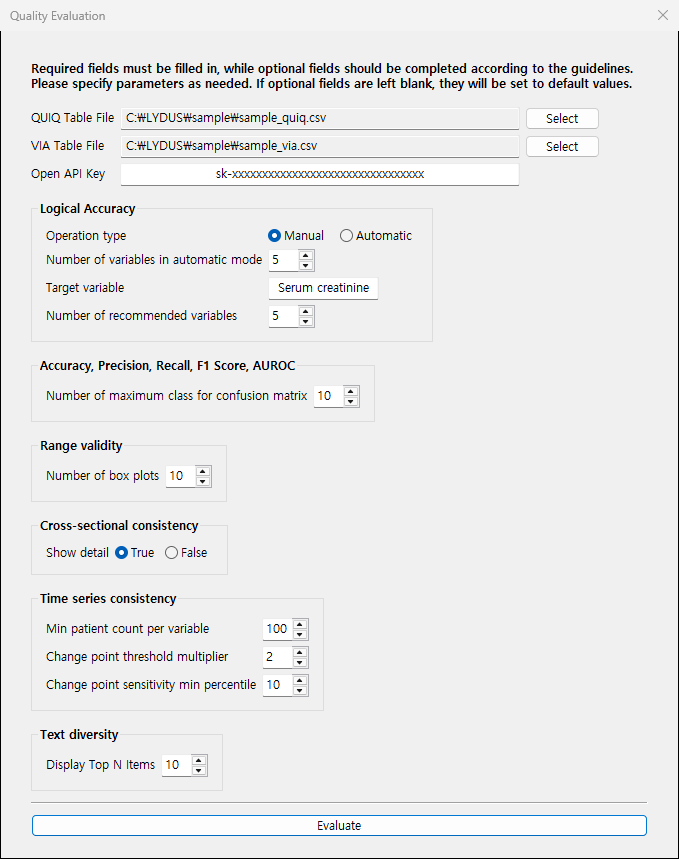
Starting an evaluation opens a settings dialog for the QUIQ and VIA files, the OpenAI API key, and the per-metric parameters. Arguments that had been scattered across separate scripts are gathered onto one screen and grouped under their metric: the target and recommended variable count for logical accuracy, the maximum class count for the confusion matrix, the number of box plots for range validity, the threshold multiplier and minimum percentile for change point detection, and the top-N cutoff for text diversity. Blank fields fall back to defaults. If a file's columns do not match the expected format, that is reported before the run begins.
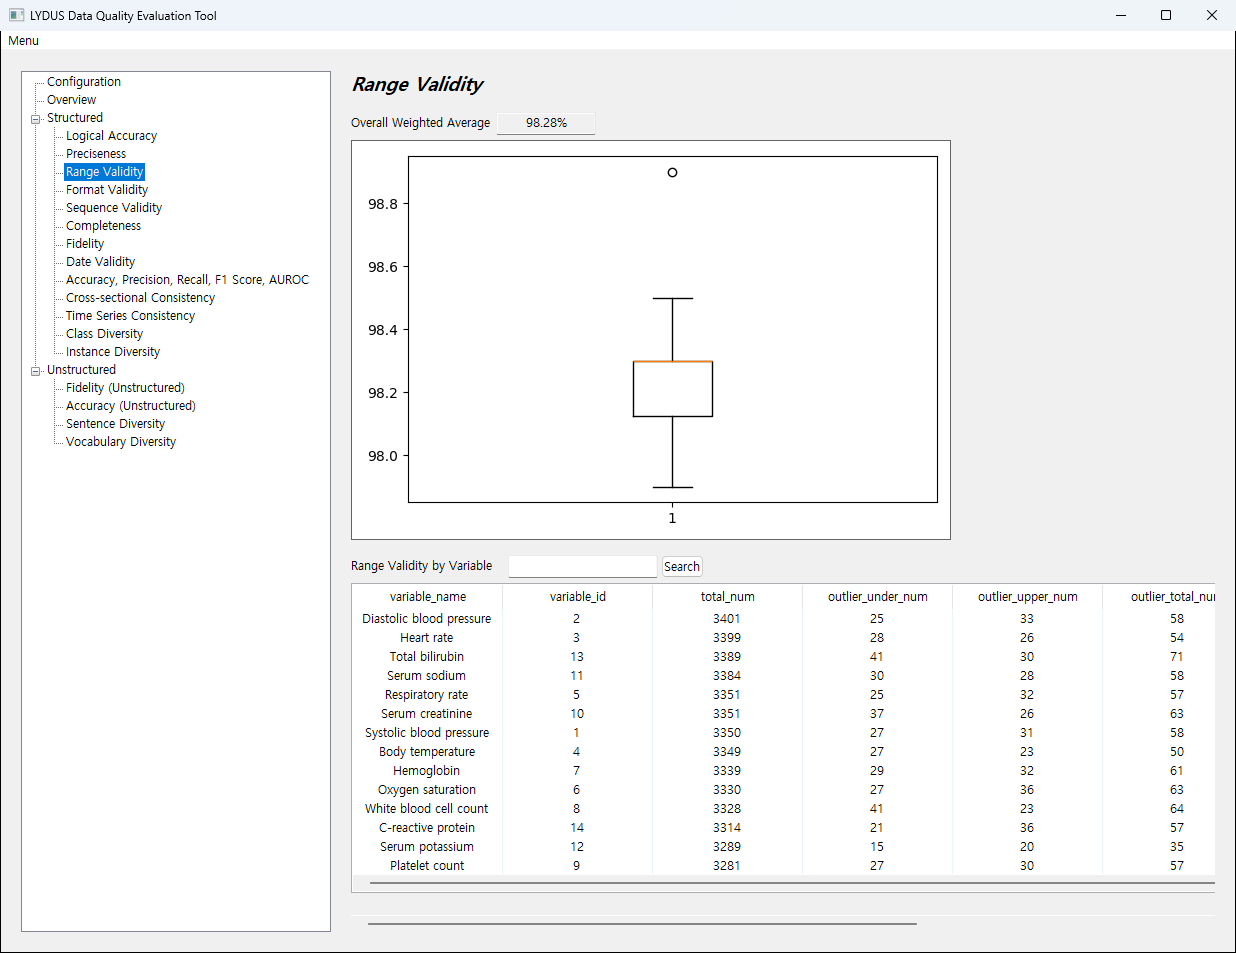
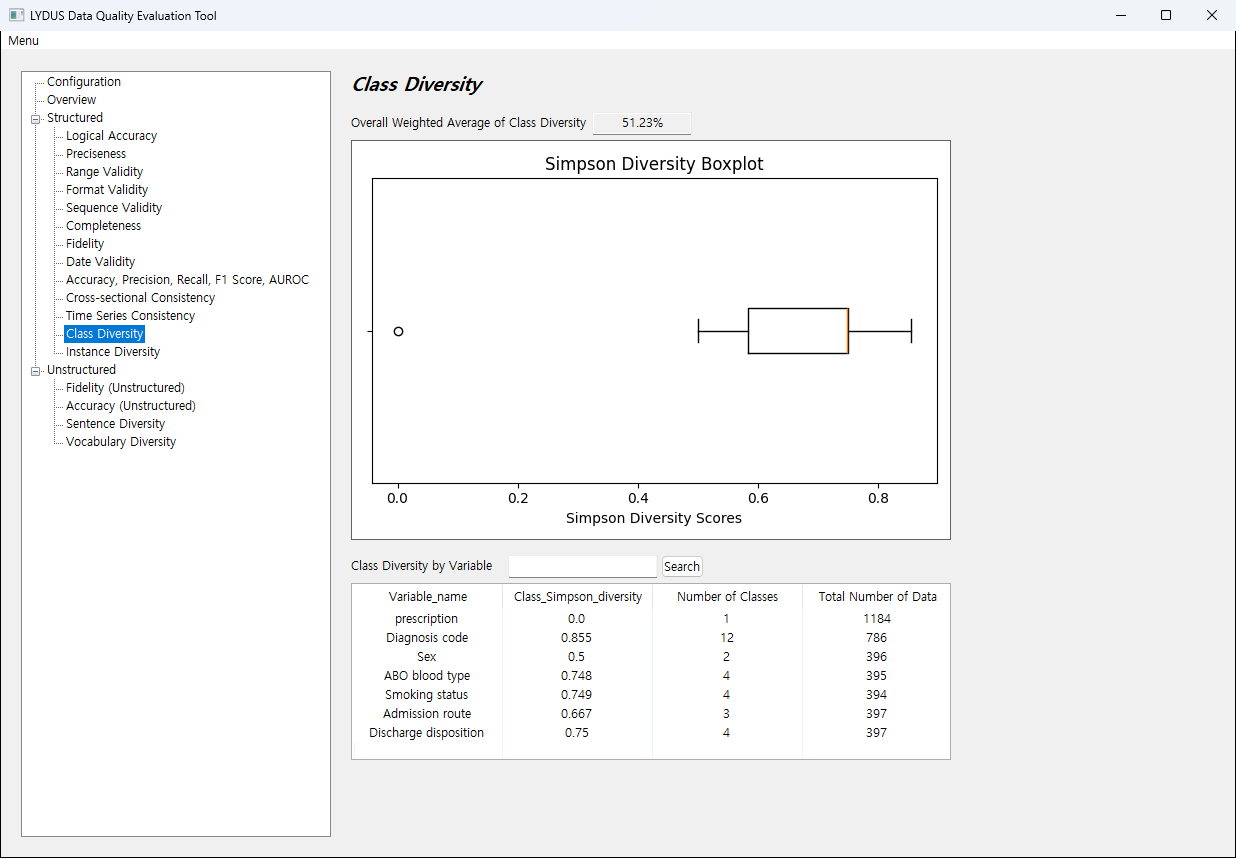
The run itself is a single action. All 17 modules execute in turn, and each metric's panel takes only the parts it needs out of whatever shape that module returned. Every panel follows the same arrangement — an overall weighted average, a distribution chart and a searchable per-variable table — so output that differs module by module looks consistent on screen.
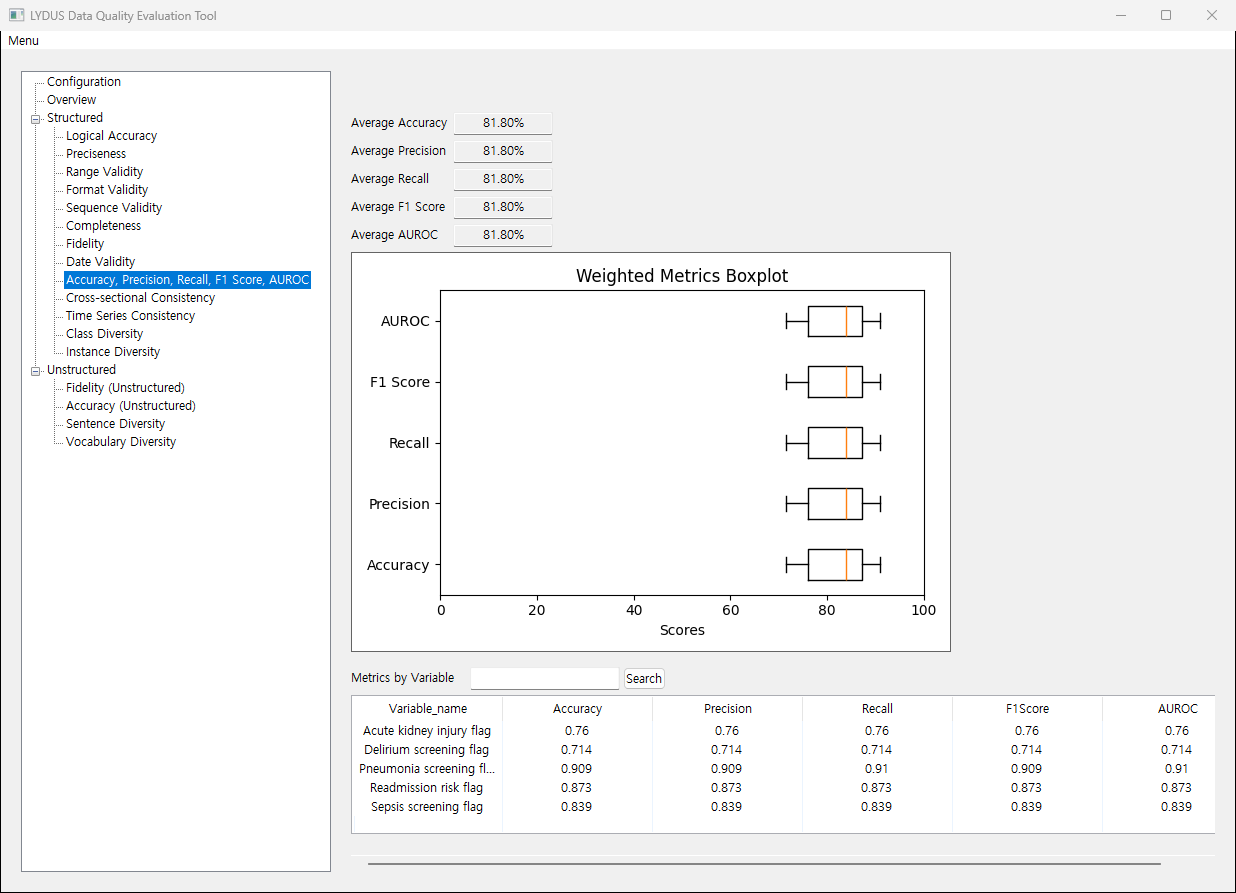
Metrics that need value-level inspection, such as range validity, open a separate view listing upper and lower outliers alongside that variable's distribution. Variables that carry a ground truth also get accuracy, precision, recall, F1 and AUROC, computed per variable and compared side by side.
Implementation
Most of the integration work was absorbing the modules' differences on the application side.
Handling results of different shapes
Each result is stored under its metric name, and the code that unpacks it lives only in that metric's panel and save routine. However the length or composition of a module's returned tuple varies, that knowledge sits in one place, so there is a clear spot to change when a module changes. The save routine unpacks each metric's result and writes CSV files and chart PNGs into per-metric subfolders, keeping the record of which files come from which metric in a single file.
Progress and cancellation
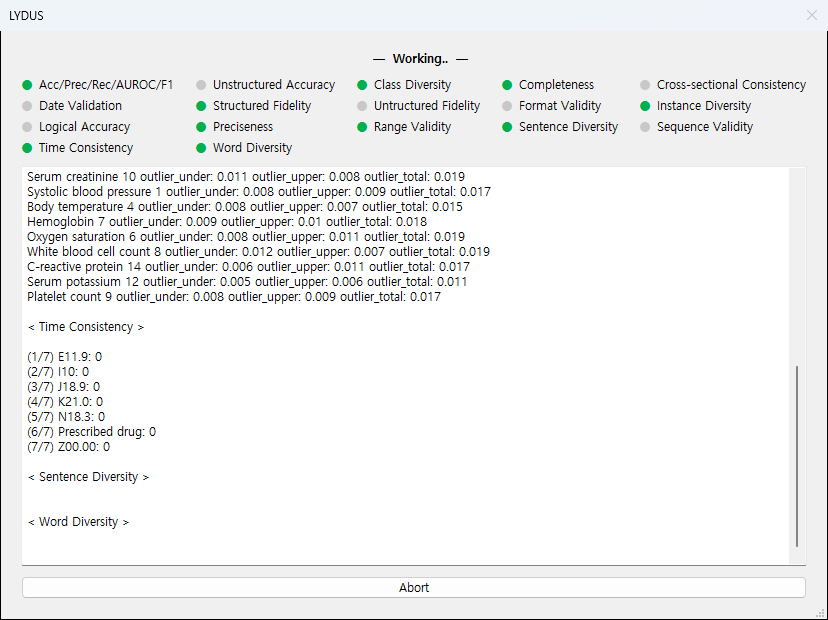
Evaluation runs on a worker thread so the UI stays responsive. The progress dialog shows each of the 17 metrics as a grey, amber, green or red indicator. Output that each module produced in its own way is brought together by redirecting standard output and standard error into an in-window log, so whatever a module prints internally is visible without the module being modified.
Cancellation goes through a single shared Event. A check call is placed inside the modules' long loops; pressing abort raises at the next check point and unwinds the computation. Nothing is force-killed from outside the loop, so no intermediate state is left broken.
Tolerating partial failure
Each module is wrapped individually, so a failure shows up as a red indicator and a traceback in the log while the run moves on to the next metric. A language-model metric failing on a key or network problem leaves every statistical result intact. Saving works the same way: metrics that fail to write are collected and reported together, and the rest are still saved.
What the modules compute
The integrated modules work as follows.
- Range validity splits upper and lower outliers on an IQR threshold, and preciseness applies a Gini-Simpson index to the distribution of trailing digits to infer the granularity values were actually recorded at.
- Class and instance diversity use the same index, applied to categorical variables and to per-patient repetition respectively.
- Time series consistency walks a variable's yearly values through one-step ARIMA forecasts, accumulates the forecast errors, and marks a point as a change point when it clears both a multiple of its neighbours' mean and a minimum percentile.
- Logical accuracy asks a language model for variables known to correlate with the target, bounds the normal range with gradient boosting quantile regression and quantile regression, and adds autoencoder reconstruction error to surface records that fall outside it.
- Variables with a ground truth go through scikit-learn's classification metrics and ROC curves, weighted by each variable's sample count.
- Free-text records are checked against per-document-type templates, with a language model judging whether a note fills in the template's sections. Sentence and vocabulary diversity use NLTK tokenisation and part-of-speech tagging to extract verb phrases and nouns before aggregating.
Packaging
PyInstaller bundles the application as a single distribution folder with no console window, so no Python environment is needed to run it. The full text of every open source license the modules bring in is readable from a menu entry inside the application.
Result
Analysis modules that had been scattered now run as one procedure in one place. There is no need to open separate scripts and line up their arguments and execution order, and the settings a given set of results came from stay visible in the configuration panel.
Checking data quality no longer requires having written the modules. Two CSV files are selected, evaluation is started, and the results can be narrowed from the overall summary to the per-variable breakdown and on to individual outliers.
Because computation and presentation are separated, adding a metric or changing how one is computed is confined to that module and its panel. Every metric's computed tables and charts are written out together, ready to carry into a report or further analysis.
Technology
- Python
- wxPython
- pandas
- scikit-learn
- PyTorch
- statsmodels
- matplotlib
- OpenAI API
Screens
Have a project in mind?
Tell me about the problem and where things stand, and we can work out the right approach together.
Discuss a project