Engineering · 2024
Real-Time Weld Bead Width Prediction
A desktop application that captures CCD images and arc spectra during welding and predicts bead width
The application acquires CCD camera images and spectrometer readings while a weld is in progress and feeds both into a neural network that predicts bead width on screen. When a run finishes, the video, the spectra and the predicted widths are written out for the same time window.
- Client
- Korea Institute of Industrial Technology
- Category
- Engineering
Overview
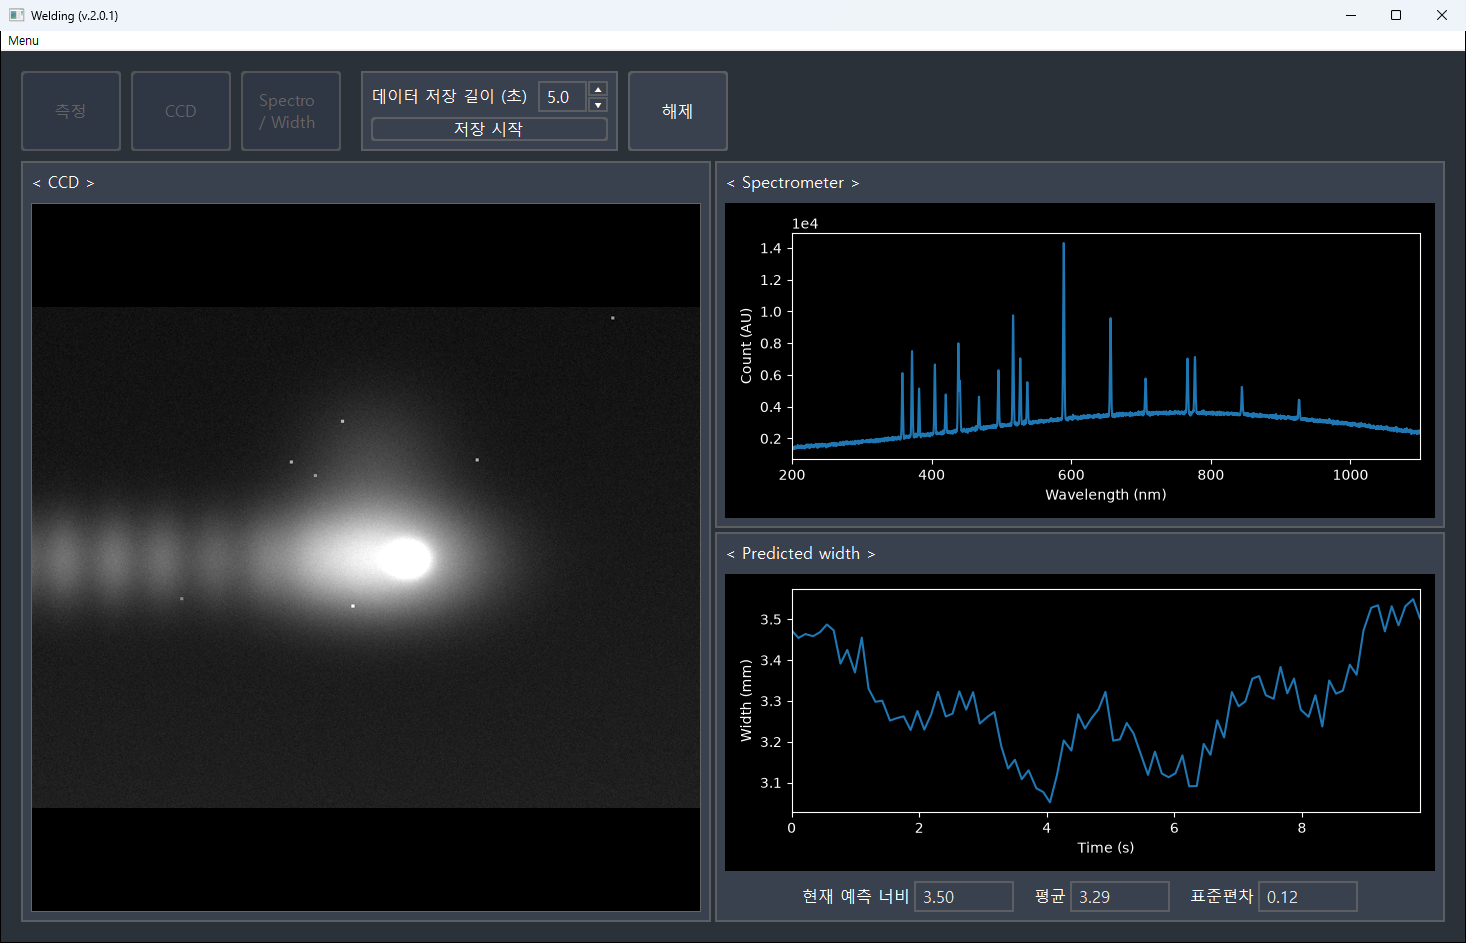
A Windows desktop application used in welding process research. While a weld is in progress, a CCD camera records the molten pool and a spectrometer measures the arc spectrum. A neural network takes both signals and predicts the weld bead width.
A single screen holds the camera feed, the spectrum and the predicted bead width. Alongside the current value, the application shows the mean and standard deviation over the displayed window. When a run finishes, the video, the spectra and the predicted widths are each written to a file for later review.
Researchers use this at the equipment itself, so everything happens in one program: configuring the devices, connecting to them, measuring, and saving.
Challenge
Predicting bead width requires a camera frame and a spectrum from the same moment. The two instruments, however, run on their own schedules: the camera is driven by its frame rate and the spectrometer by its integration time, and nothing synchronises them. Neither device delivers data at exactly the interval it was configured for.
On top of that, the display has to keep updating while acquisition runs. If reading from the devices and drawing the screen wait on each other, both slow down.
Solution
The program is divided into three screens.
- Measurement: connect to the devices and watch the image, spectrum and predicted bead width in real time
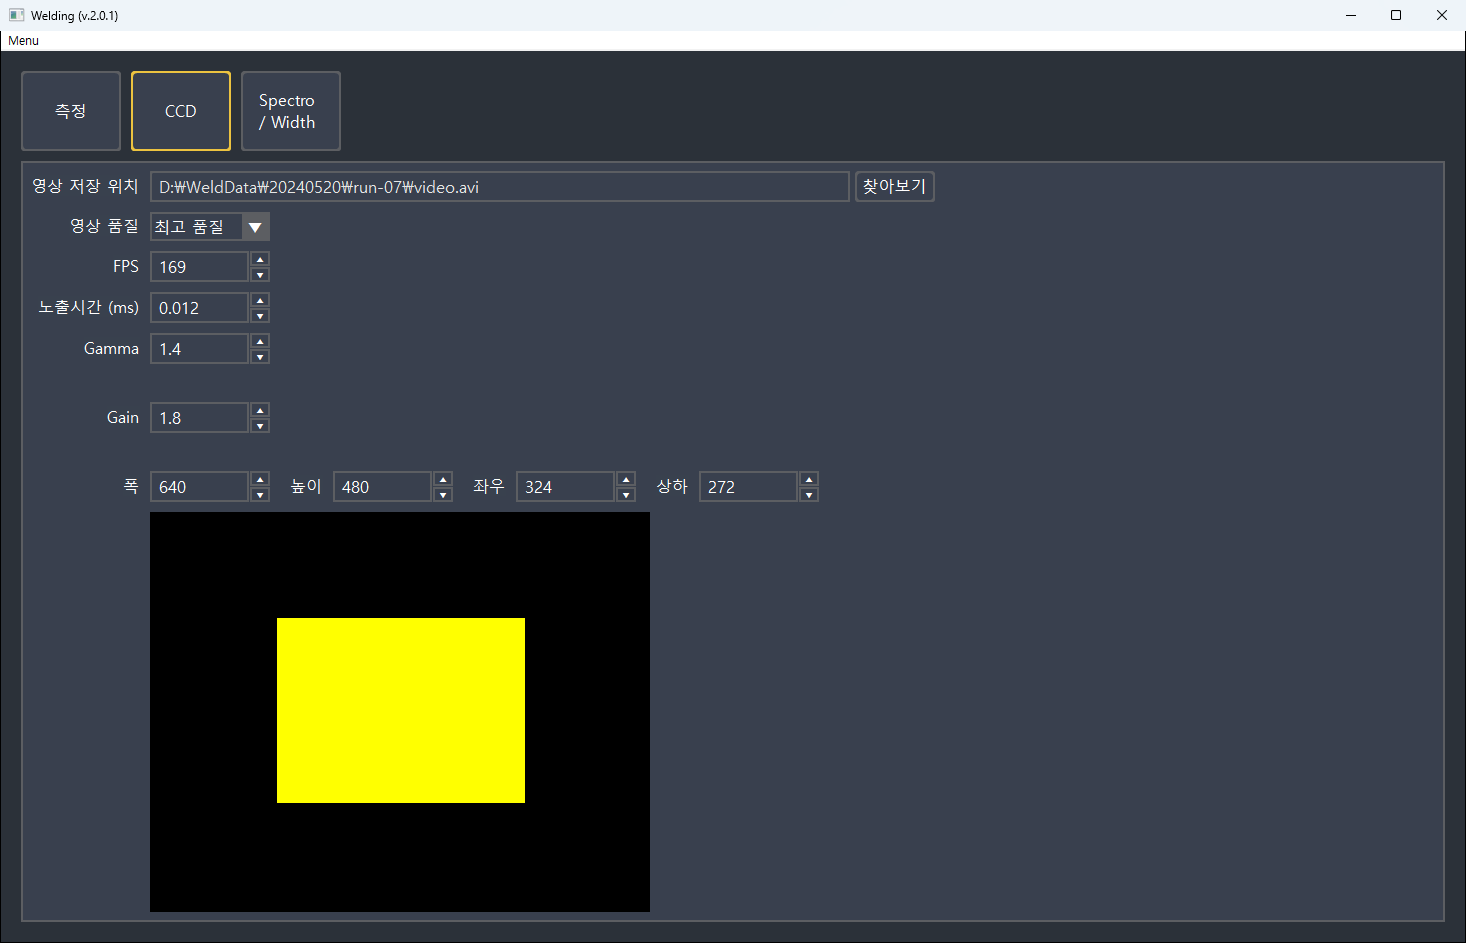
- CCD: camera ROI, exposure time, gamma, gain and frame rate, plus video output settings
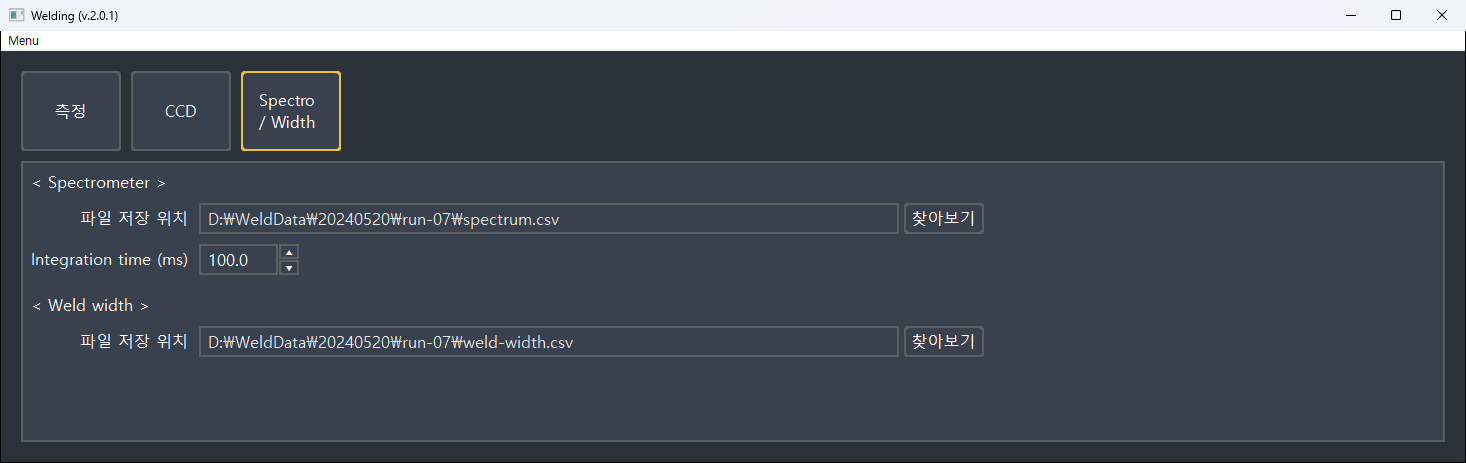
- Spectro / Width: spectrometer integration time and the output paths for spectra and predicted widths
One connect button opens both instruments and starts acquisition. Once connected, the application pulls the latest data from each device every 100 milliseconds, refreshes the display and predicts the bead width.
To record a run, the operator sets a capture length between 1 and 9.9 seconds and presses start. Once that much data has accumulated, acquisition stops and the time-aligned video, spectra and predicted widths are written to disk.
Device settings can be saved to and loaded from a JSON file, so a repeated measurement under the same conditions does not have to be set up again by hand.
System architecture
Components
- Camera layer: drives an iDS uEye camera through
pyueye, setting ROI, exposure, gamma, gain and frame rate, and reading 8-bit mono frames - Spectrometer layer: drives an Ocean Optics spectrometer through
seabreeze, setting integration time and reading the wavelength axis and intensities - Prediction layer: a Keras model that takes an image and a spectrum as two inputs and outputs a bead width
- UI layer: built with wxPython, with matplotlib figures embedded for the graphs
Data flow
- One acquisition thread per device stores each sample in a ring buffer together with a timestamp
- A UI timer pulls the newest sample from each buffer every 100 milliseconds, draws it, and passes both through the model to get a bead width
- On save, the timestamps from the two buffers are matched up and trimmed to the requested length before being written out
Implementation
Aligning two instruments in time
Each acquisition thread records the moment a sample arrived using time.perf_counter(). At save time the buffer with fewer samples sets the timeline, and for each of its timestamps the nearest sample from the other buffer is paired with it. The two acquisition rates can differ and the output still comes out the same length.
The camera is read faster than the configured frame rate. At high frame rates it is hard to pull frames at exactly the requested interval, so frames are collected with margin and, on save, only those closest to the target timestamps are assembled into the video.
Buffering and error handling
Each buffer is a bounded deque, so older data is discarded automatically and memory use stays flat however long acquisition is left running.
Exceptions raised inside a device thread are not surfaced there; they are stored as text. The UI timer checks for them on each tick, and if one is found it shows the message and tears down both connections. This keeps the acquisition threads and the display from blocking each other.
Shipping the model
The trained model ships inside the application and is written out on first run if the model file is missing. Replacing that file applies a different model without changing the program.
Interface
Buttons, text fields, combo boxes and spin controls are drawn directly rather than using the stock wxPython widgets, so that they look consistent against the dark background. The camera view scales with the window while keeping its aspect ratio, and the ROI settings are accompanied by a diagram showing which part of the full sensor area is in use.
Result
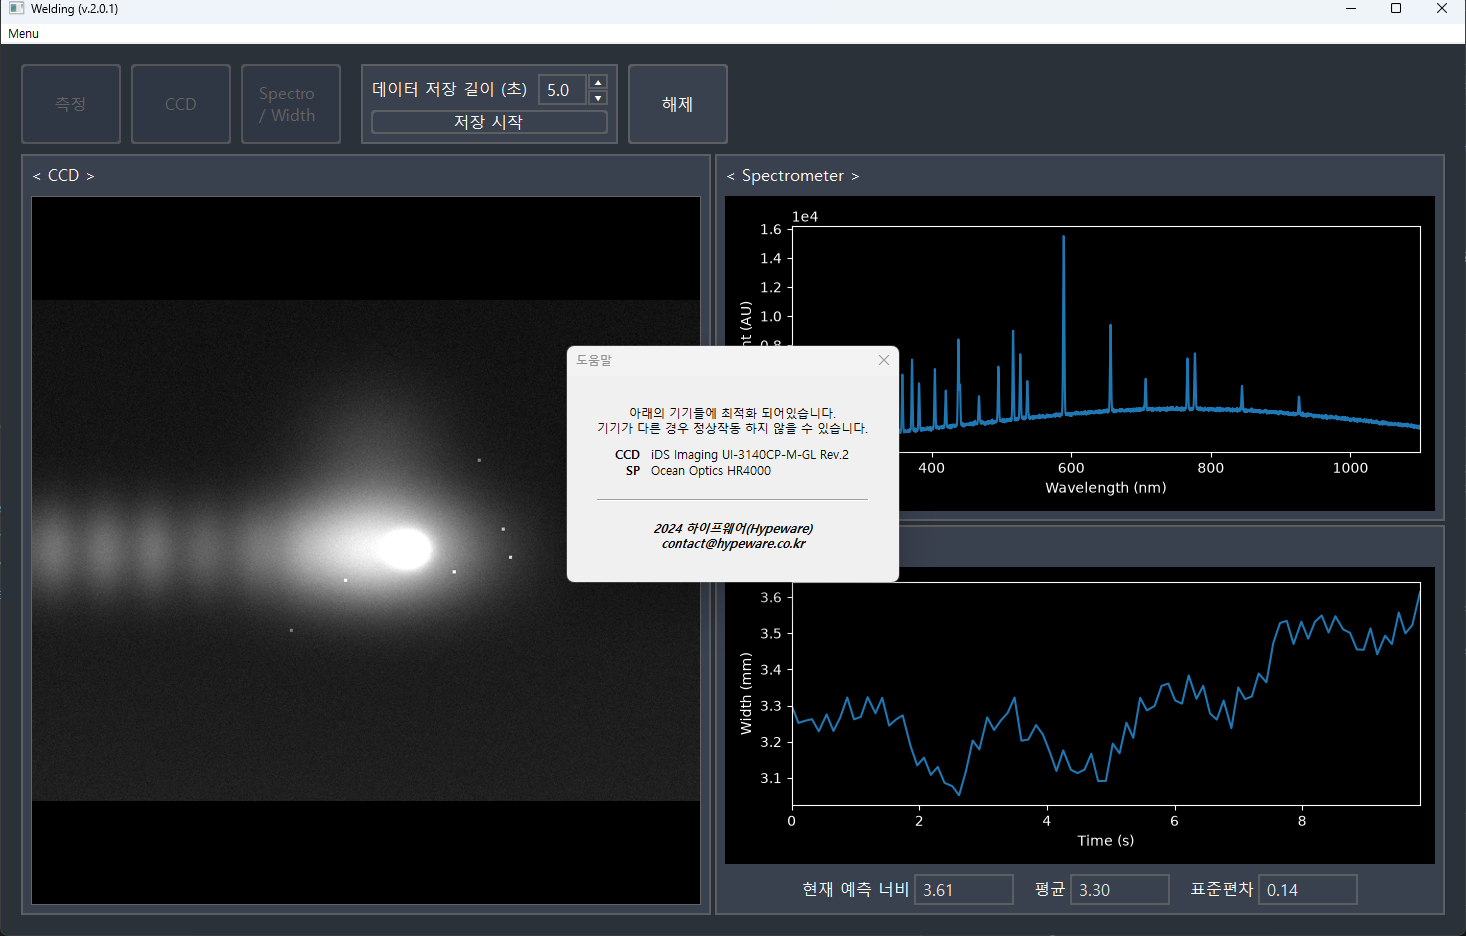
Predicted bead width is visible on screen while the weld is running, with no need to stop and compute the result separately.
A single run leaves behind video, spectra and predicted widths covering the same time window. Because the three are aligned, they can be reanalysed later or fed back into training as they are.
Saved configuration files make a measurement repeatable under the same conditions, and swapping the model file is enough to apply a different prediction model.
Technology
- Python
- wxPython
- Keras
- NumPy
- OpenCV
- matplotlib
Screens
Have a project in mind?
Tell me about the problem and where things stand, and we can work out the right approach together.
Discuss a project