Data · 2024
Dissolution Testing Data and Equivalence Analysis
Desktop app that turns instrument readings into dissolution rates and keeps every result on a shared server
Reads the data files analytical instruments produce, calculates dissolution rates at each sampling point, and stores them with the test conditions so results can be compared side by side and assessed for equivalence.
- Client
- Confidential client
- Category
- Data
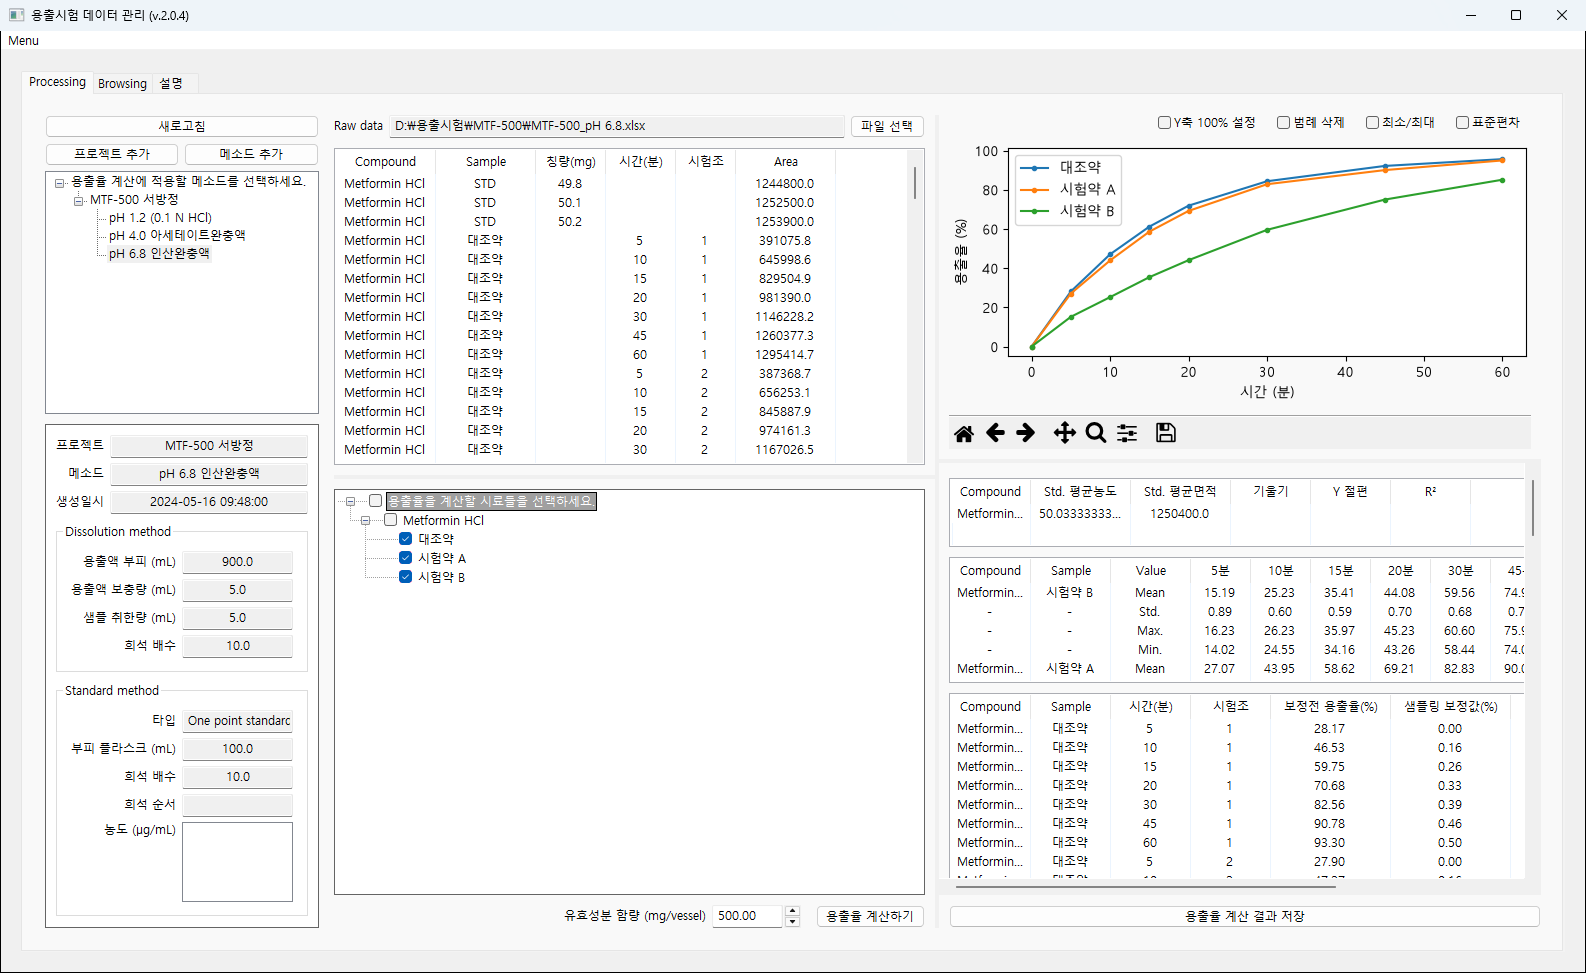
Overview
- Desktop program for dissolution testing staff at a pharmaceutical CMC research center
- One place for the whole run: import instrument data, calculate, store, compare, export a report
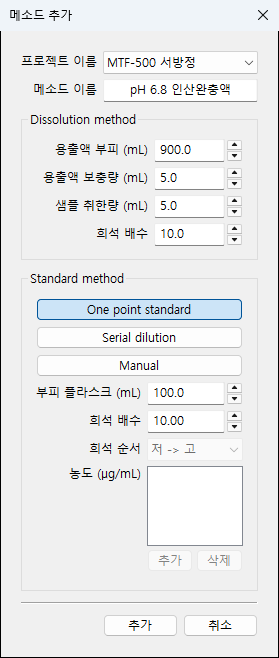
- Test conditions registered per project and reapplied to every run
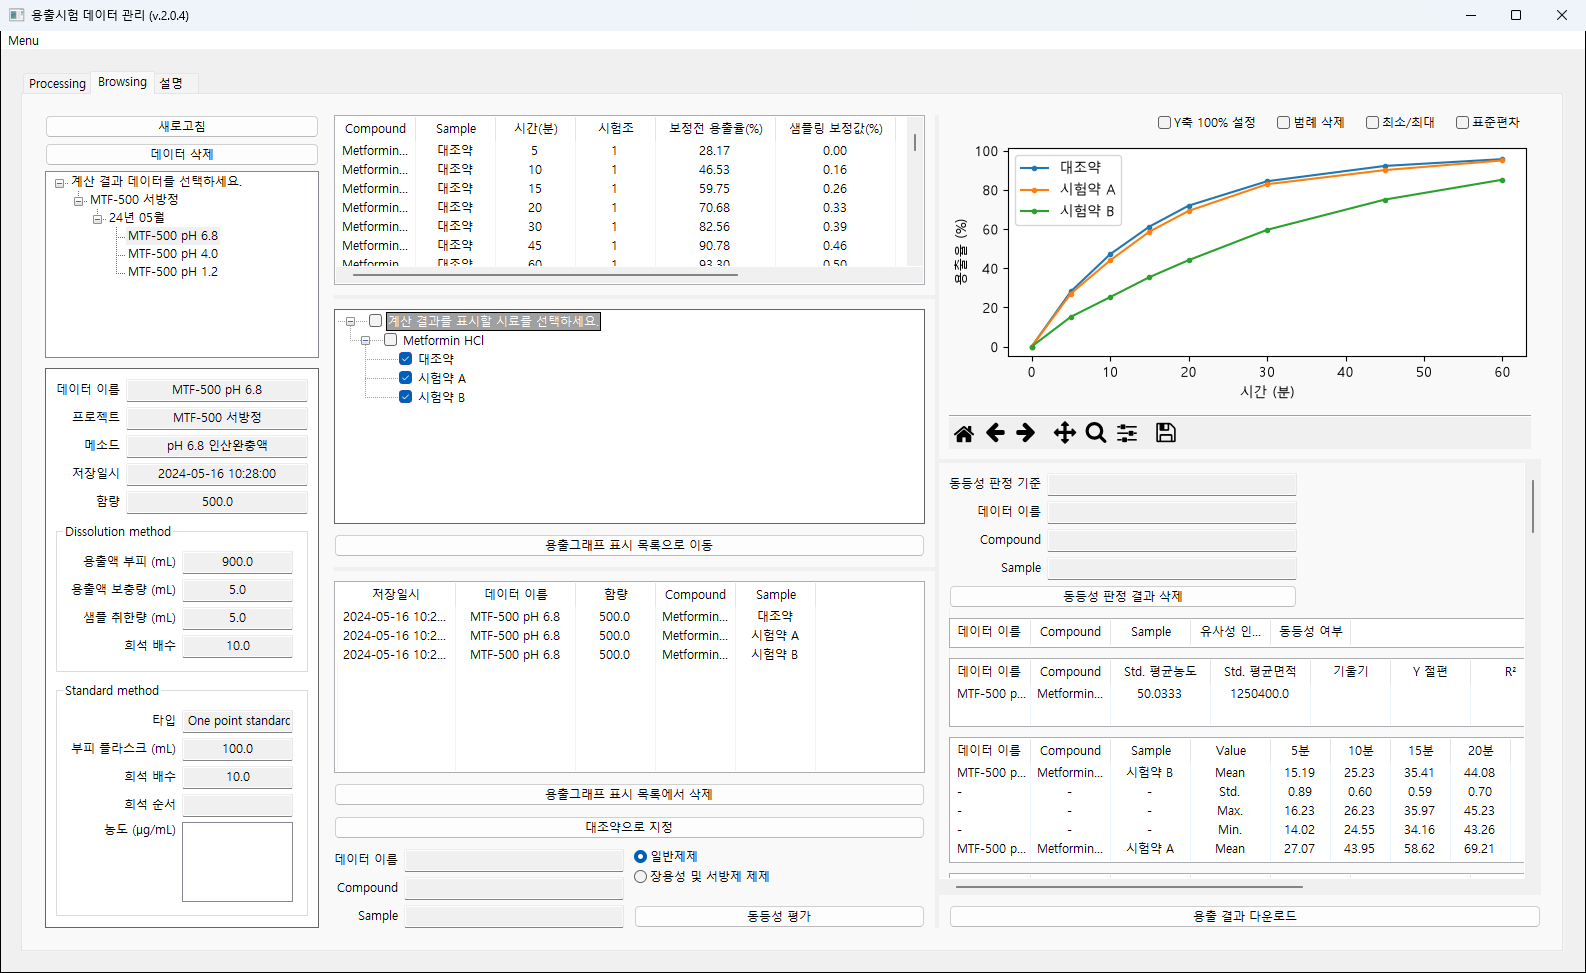
- Results kept on a shared server rather than individual PCs, so past tests stay available
Challenge
- Instrument readings retyped into spreadsheets, with formulas built by hand for each calculation
- A different output layout per instrument vendor, each needing its own handling
- Medium replaced after every withdrawal, so the correction accumulates with each sampling point and is easy to get wrong by hand
- Calculation files scattered across individual PCs, making past results hard to find and compare
- Equivalence criteria differing by formulation type, with the reasoning written up by hand each time
Solution
- Instrument files read as they are, separating standards from samples and picking up sampling time and vessel number from sample names
- Three output layouts recognized: Waters, Agilent UPLC, Agilent HPLC
- Three ways of handling standards: single-concentration standard, serial dilution, manually entered concentrations
- Corrections accumulated by sampling order, with uncorrected and corrected rates shown together
- Test conditions stored alongside the result, so the conditions behind a number are visible from the result itself
- Conditions registered as medium volume, replacement volume, sampling volume, dilution factor and standard handling
- Registered conditions copied and adjusted, instead of re-entering a run that differs only by medium
System architecture
Flow of work
- Instrument data file → dissolution calculation → shared server → graph comparison → spreadsheet report
- Project → test conditions → calculated results, with results reached by project and by month stored
- Server credentials held in encrypted form
Implementation
- Instrument layout identified from the report title in the file's first cell, so no vendor has to be chosen by hand
- Older file formats converted on read, leaving the file from the instrument untouched
- Calibration built from standard weights and peak areas, with slope, intercept and coefficient of determination kept with the result
- Samples from different runs drawn on one graph, with mean, standard deviation, minimum and maximum
- Legend, Y-axis range and deviation markers toggled to get the view wanted
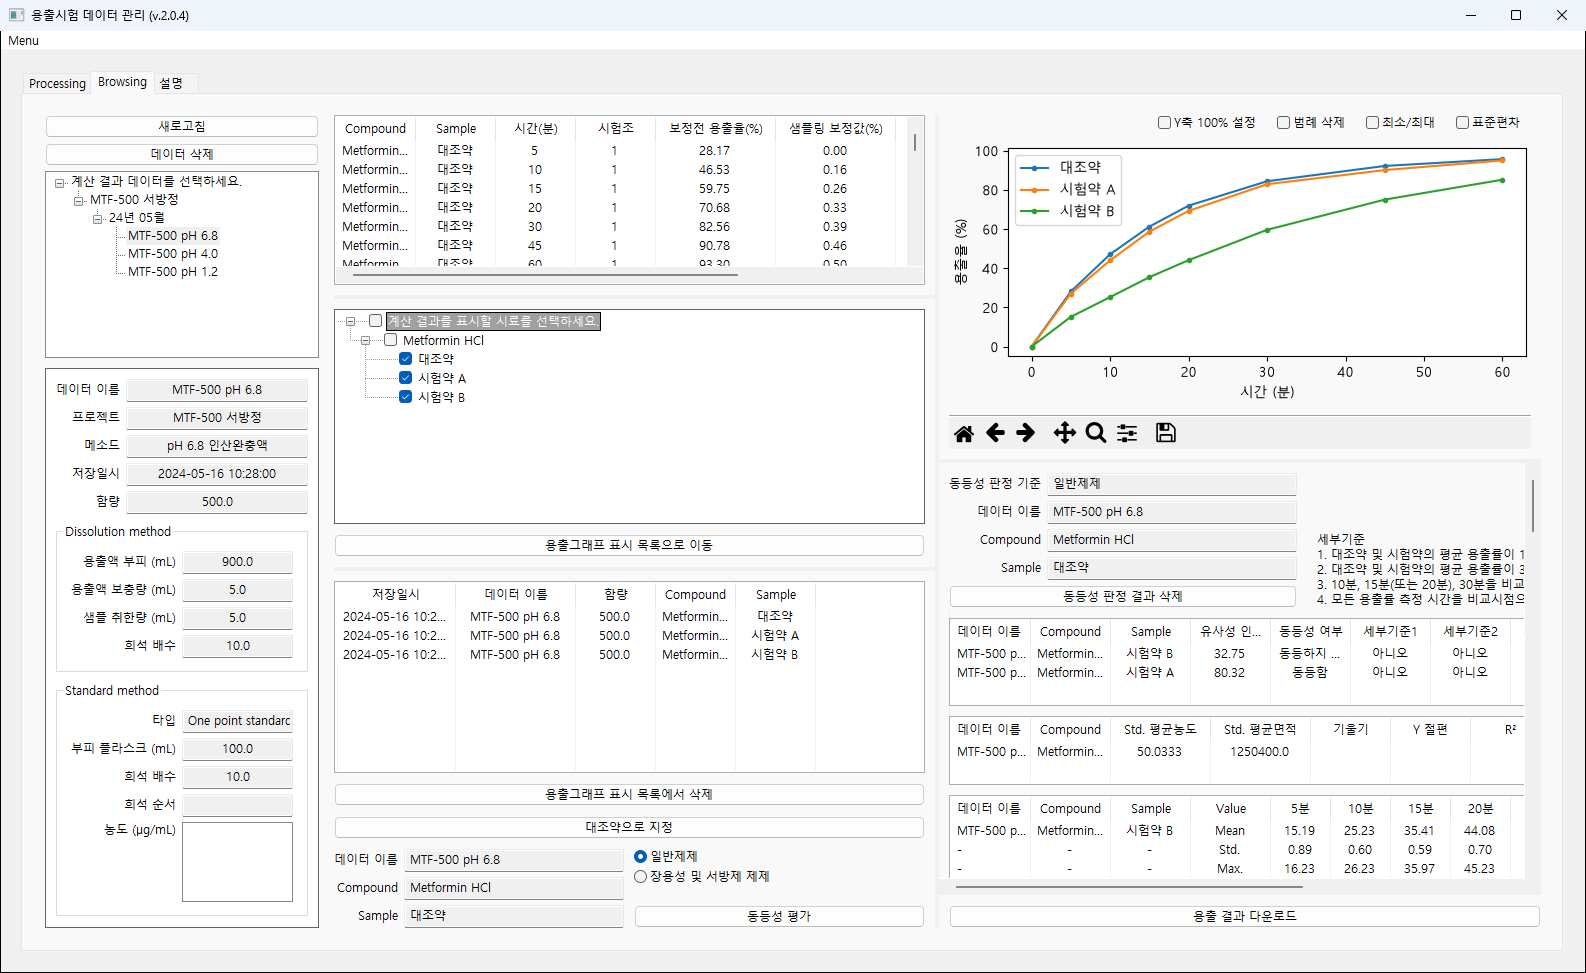
- Equivalence assessed under separate criteria for immediate-release and for enteric-coated or extended-release products
- Similarity factor reported together with each criterion met or missed, leaving the path to the verdict visible
- Report exported as a spreadsheet holding measurements, dissolution tables, curves, verdicts and the decision flow
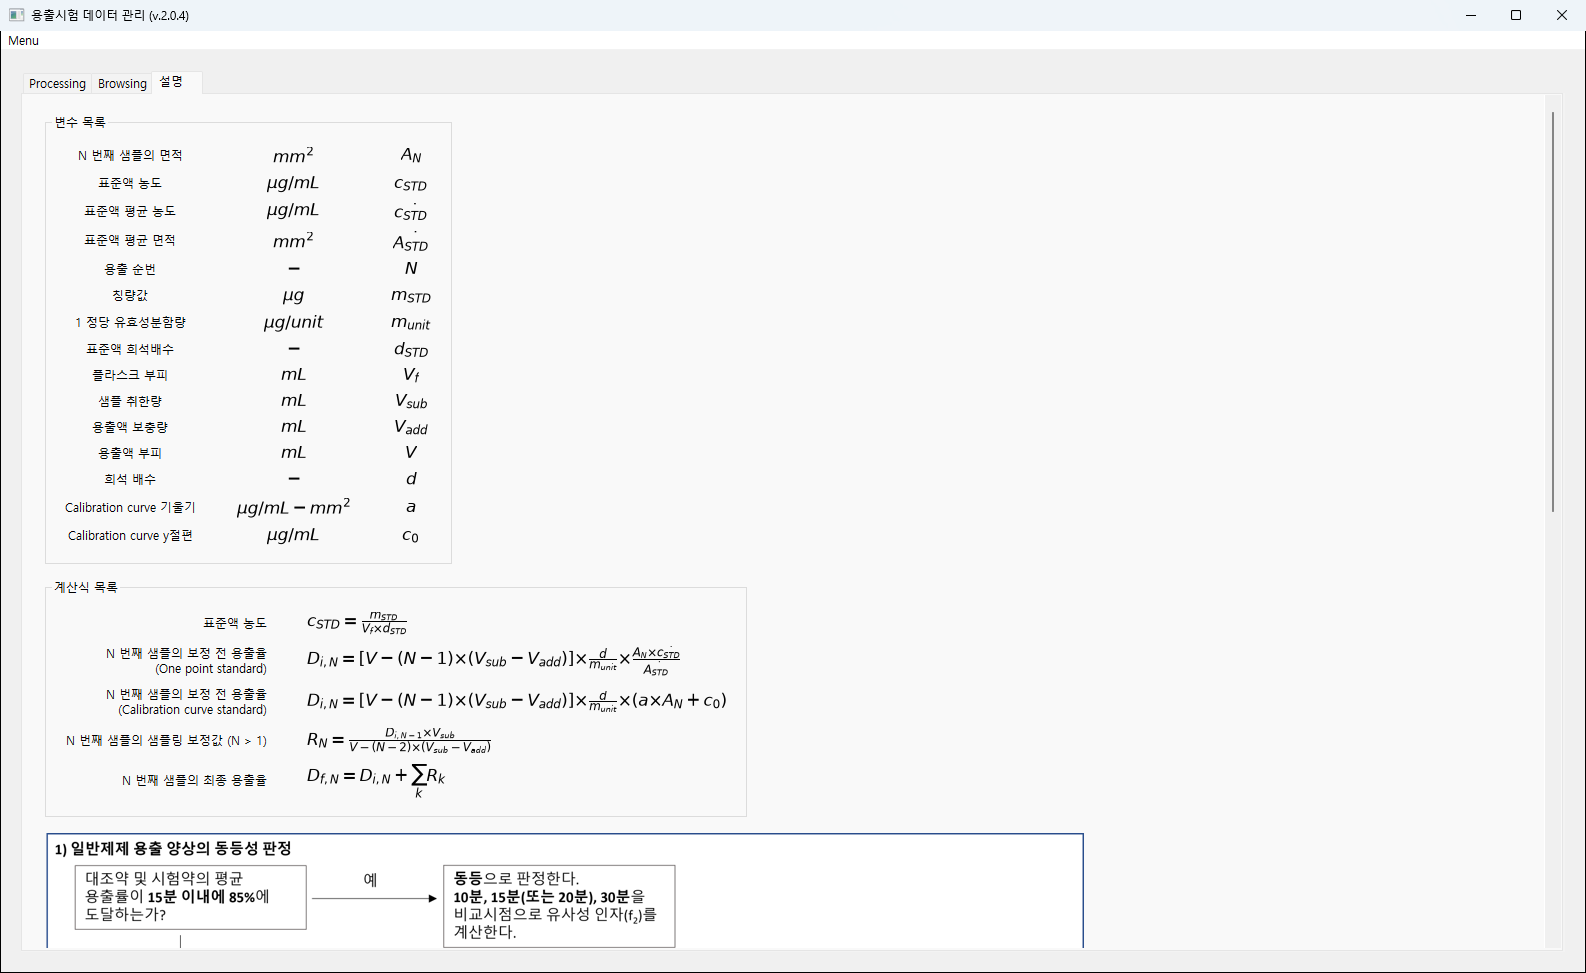
- Calculation variables with units, dissolution formulas and the decision flow built into the program
- Grounds for a number checked on screen rather than looked up elsewhere
Result
- Calculation, storage and reporting finished inside one program, starting from the instrument file
- Manual entry and hand-built formulas removed, so the same conditions give the same result
- Results gathered on the server, letting runs in different media or different samples be overlaid directly
- Equivalence reasoning stored with the result and carried straight into the report
- Displayed fields and calculation handling revised over several rounds as requests came in from use
Technology
- Python
- wxPython
- MySQL
- pandas
- SciPy
- matplotlib
- openpyxl
Screens
Have a problem that needs solving?
From software development to equipment integration and engineering, we can work out the approach that fits what your project needs.
Discuss a project