Engineering · 2023
Camera Control Software for Time-Resolved Spectroscopy
A desktop app covering nanosecond-gated capture, wavelength calibration and export in one window
Measurement work that meant writing down instrument settings by hand and recalculating results in separate tools is now one program - capture recorded together with its settings, checked on screen, and exported from there.
- Client
- Seoul National University
- Category
- Engineering
Overview
- Software for measurements that capture short-lived light in nanosecond slices and separate it by wavelength
- Built for the person operating the instrument at the bench
- One window for the whole run - connect, set conditions, capture, review, save and export
- Capture settings and spectroscopy settings stored in the same file as the frames, so any saved run says what produced it
Challenge
- Vendor software handled capture only - settings written down separately and matched to result files by hand
- Runs that step through several delay settings meant re-entering and re-saving at every step
- Judging whether a frame was usable required opening it in another tool, so not at the bench
- Converting pixel positions to wavelength repeated by hand for every run
- A setting past the camera's internal memory meant failure partway through a capture
Solution
- Exposure and delay timing, trigger mode, capture region, binning, gain voltage and gating set in one panel and applied together
- Capture modes chosen by purpose - fixed conditions, table-driven repeats, live preview
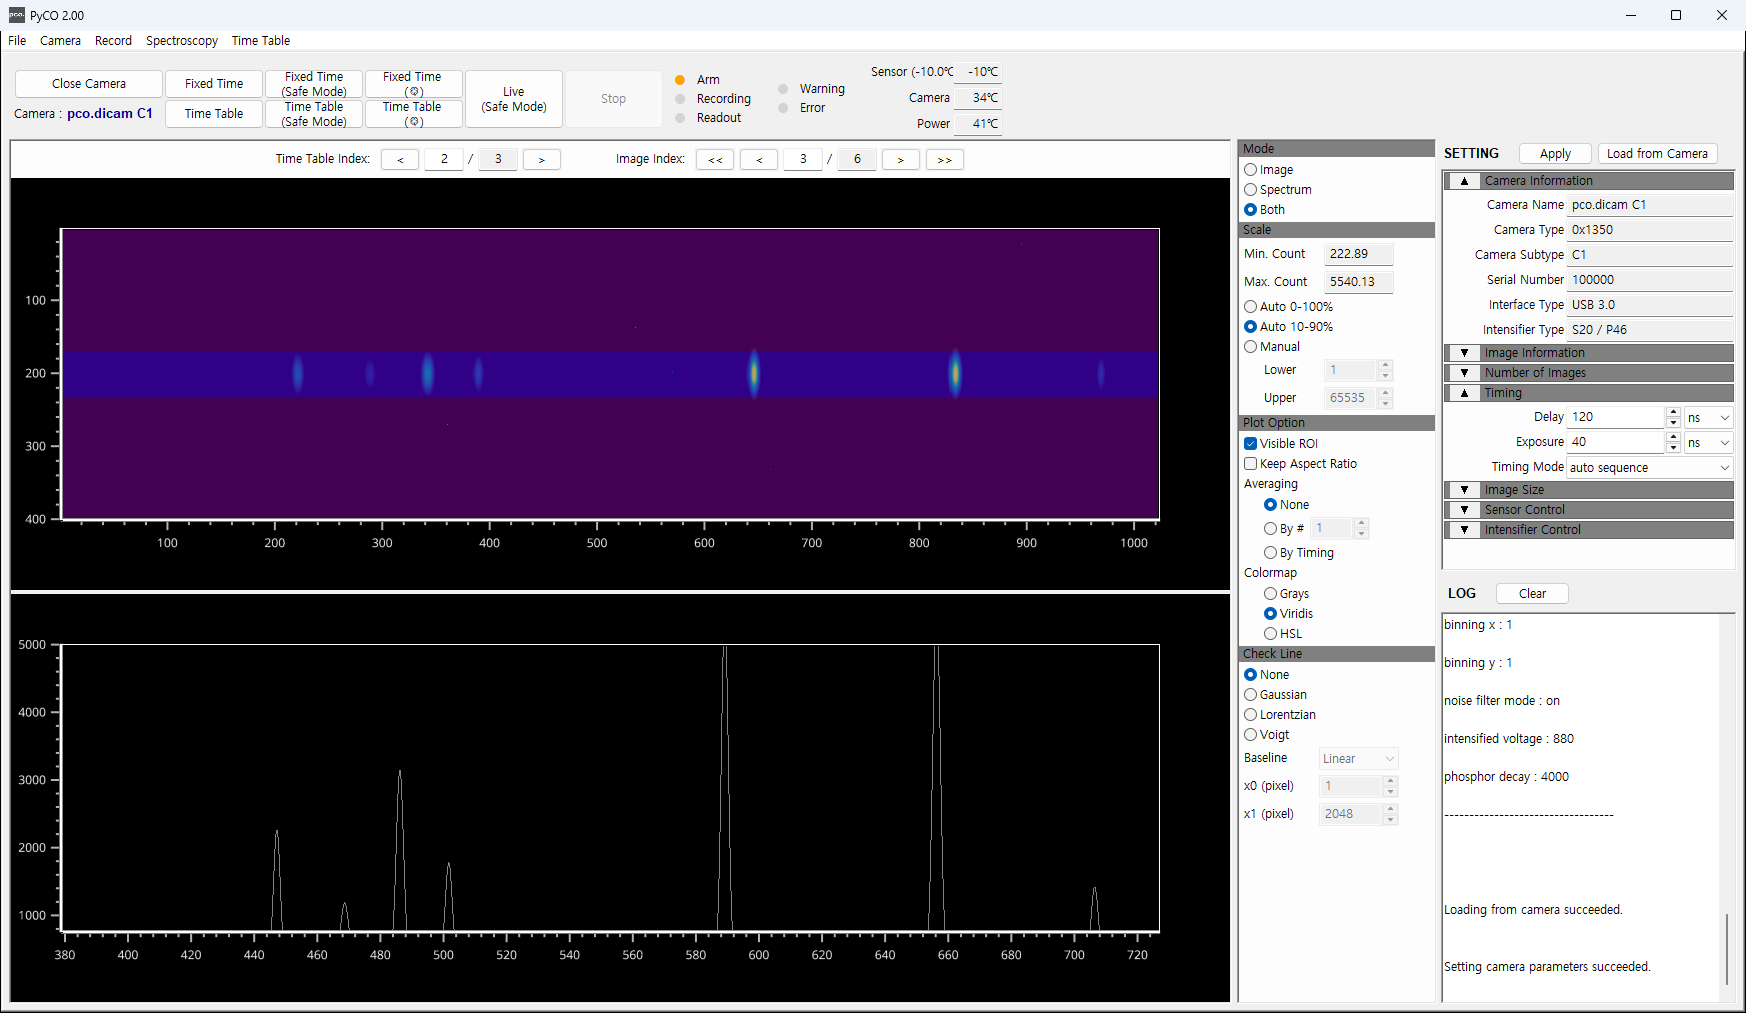
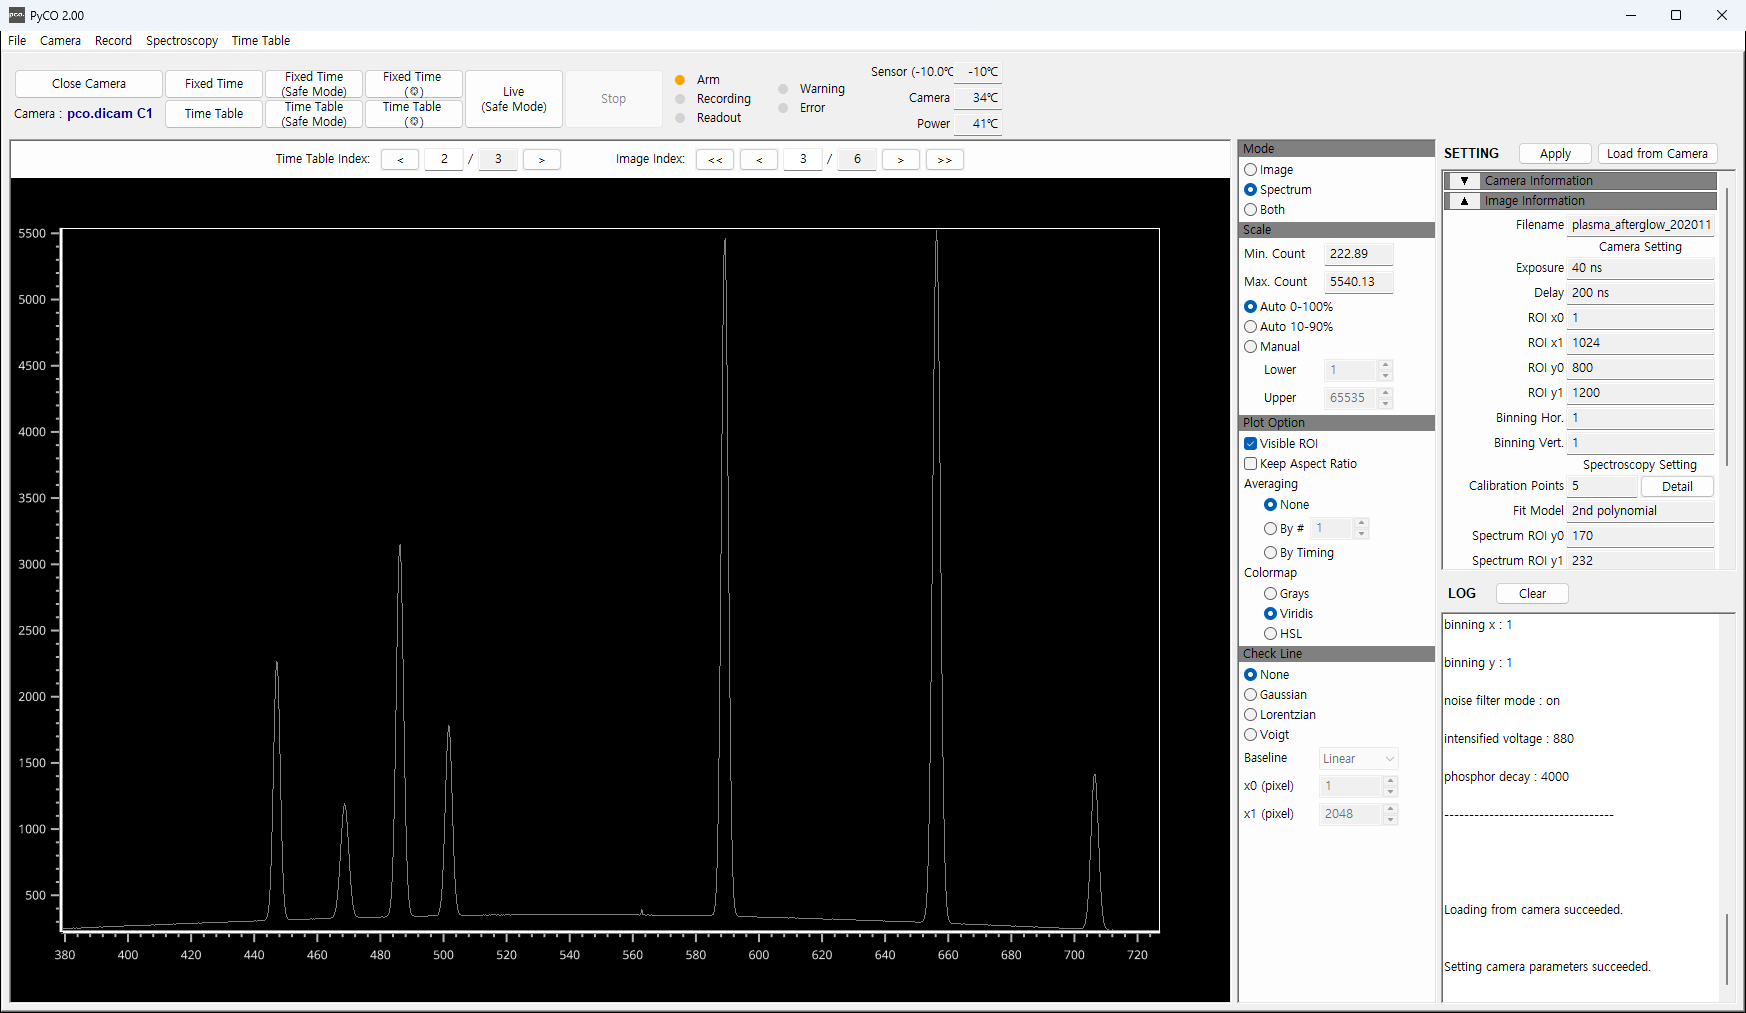
- Results shown immediately as a 2D frame and as a wavelength spectrum, either separately or both at once
- Instrument state (connected, recording, reading out) and three temperature points shown continuously at the top
- Warning and error signals from the instrument translated into readable lines in the log
- Captures saved with their settings as a single file, with several files loadable at once for comparison
System architecture
Measurement flow
- Connect camera → set conditions → capture → review on screen → save file → export in the needed format
- Table-driven runs apply each row in order and advance on their own
Screen layout
- Capture and stop controls with instrument status across the top
- Frame and spectrum in the centre, view options to their right
- Capture settings on the right panel, instrument log below
What comes out
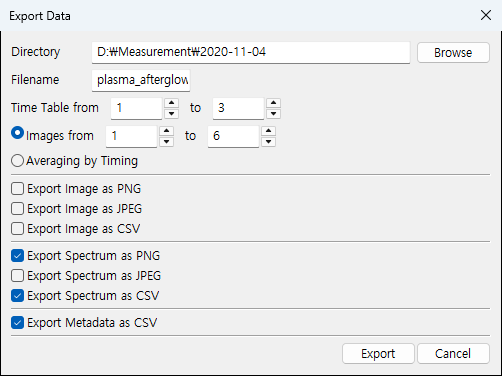
- Frames and spectra written as picture files or as numeric files
- Full capture settings written as a separate table file, ready to quote in a report
Implementation
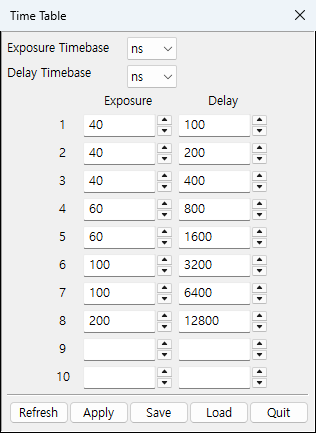
Repeating a capture across delays
- Exposure and delay pairs listed in a table, with a set number of frames captured automatically per pair
- Table saved and reloaded as a file, so the same conditions repeat in a later session
- Each pair recorded with its frames, so the delay behind any result stays identifiable
Memory check before capture
- Requested frame count checked against the camera's internal memory before capture begins
- On overflow, the available and requested counts are shown and the run stops - no failure partway through
A capture mode that drops empty frames
- Frames darker than a set threshold across every pixel are treated as signal-free and not stored
- Skipped count shown as capture runs, keeping only usable frames when signal arrives rarely
Safe mode, one frame at a time
- Capture one frame → transfer and display it → move to the next
- A saturated frame raises a warning and stops the run, protecting the gain stage from excess light
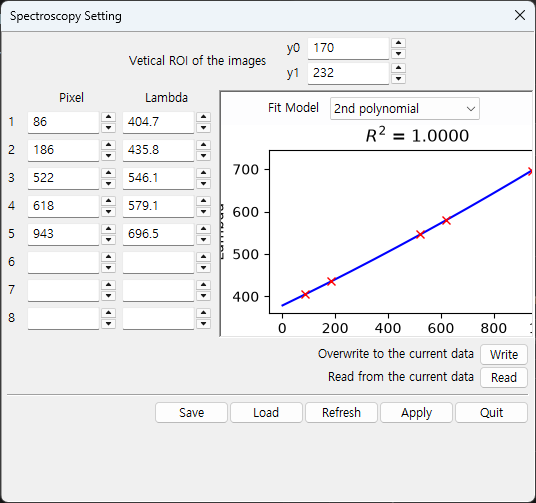
Pixel to wavelength
- Known reference lines paired with pixel positions, fitted with a polynomial from 1st to 4th order
- Fit quality shown as a coefficient of determination, so the calibration can be judged on the spot
- The resulting conversion stored with the capture, so reopening it gives the same wavelength axis
Peak analysis on screen
- A section of the spectrum fitted with one of three line shapes, giving centre position and width
- Background separated with its own polynomial from 1st to 4th order
- Analysis available on averaged frames, reducing noise where signal is weak
Settings that persist
- Spectroscopy settings and the time table saved automatically and restored at the next launch
- Settings held in the camera backed up before reset and restored afterwards, so reconnecting does not lose them
Result
- Capture, review, analysis and export in one program - no switching tools mid-measurement
- No more writing down settings and matching them to results by hand
- Any saved file states the conditions behind it, making past runs reproducible and comparable
- Repeat measurements across delays defined once in a table and run unattended
- Capture failures from bad settings blocked by a check before the run starts
- Capture conditions once copied into a lab notebook now exported as a table file for reports
Technology
- Python
- wxPython
- NumPy
- SciPy
- VisPy
- matplotlib
Screens
Have a problem that needs solving?
From software development to equipment integration and engineering, we can work out the approach that fits what your project needs.
Discuss a project