Engineering · 2024
Wireless Temperature Sensor Monitoring Display
A Windows desktop app that keeps cloud sensor readings on a screen at the site
A desktop application that pulls wireless temperature sensor readings from the cloud, keeps them on a display at the site, and raises an on-screen and audible alert whenever the reading leaves the configured range.
- Client
- Confidential client
- Category
- Engineering
Overview
The program polls the cloud's REST API for recent measurements, draws them as a trend graph alongside large numeric readouts, and raises an alert when the reading crosses the thresholds the operator has set. It is a Windows desktop application, built on the assumption that it stays open on a monitor and keeps running.
Solution
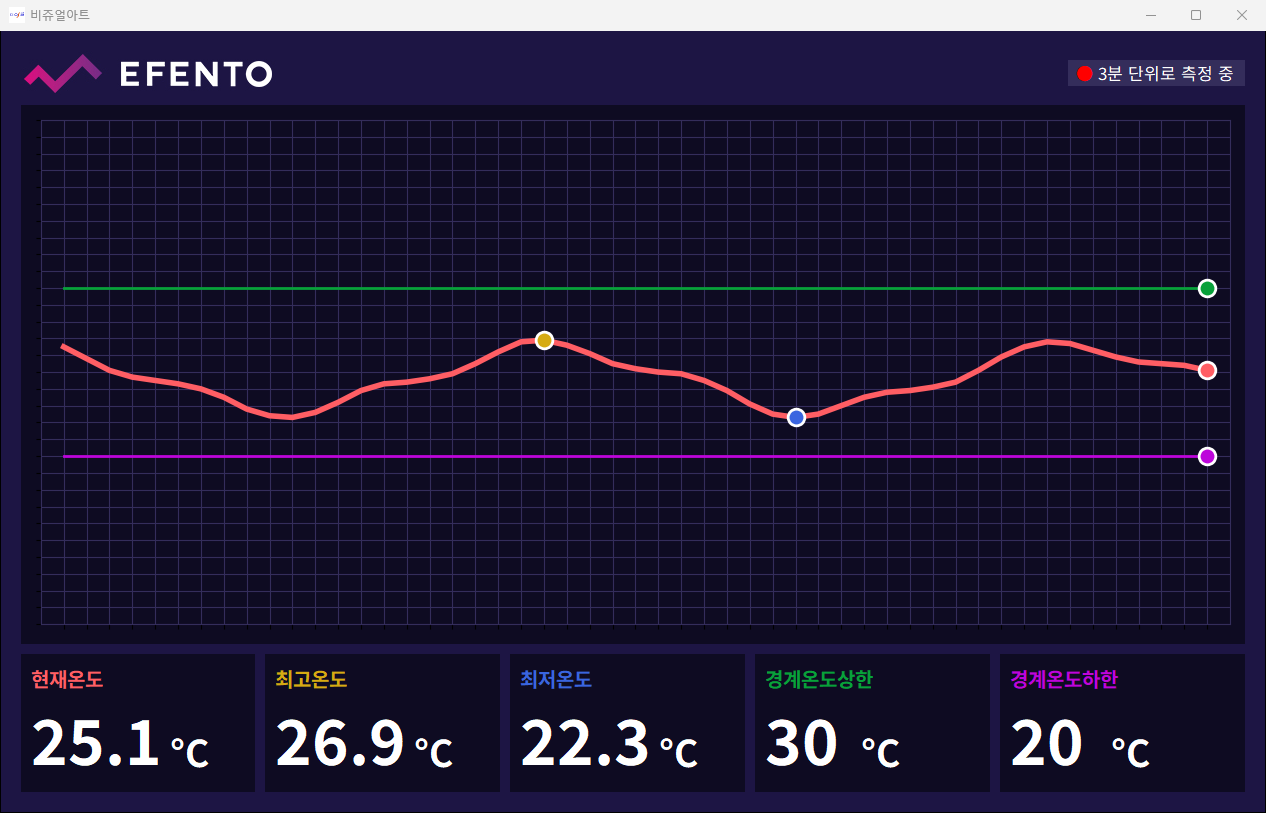
The thresholds are drawn as reference lines, with the recent temperature trend plotted over them. Markers pick out the current reading and the highest and lowest values in the window, so each can be located directly on the graph. The same values are repeated as large numbers below it.
The numeric panels resize their text to fit the window, and F5 switches to full screen, so the same layout works on monitors of any size.
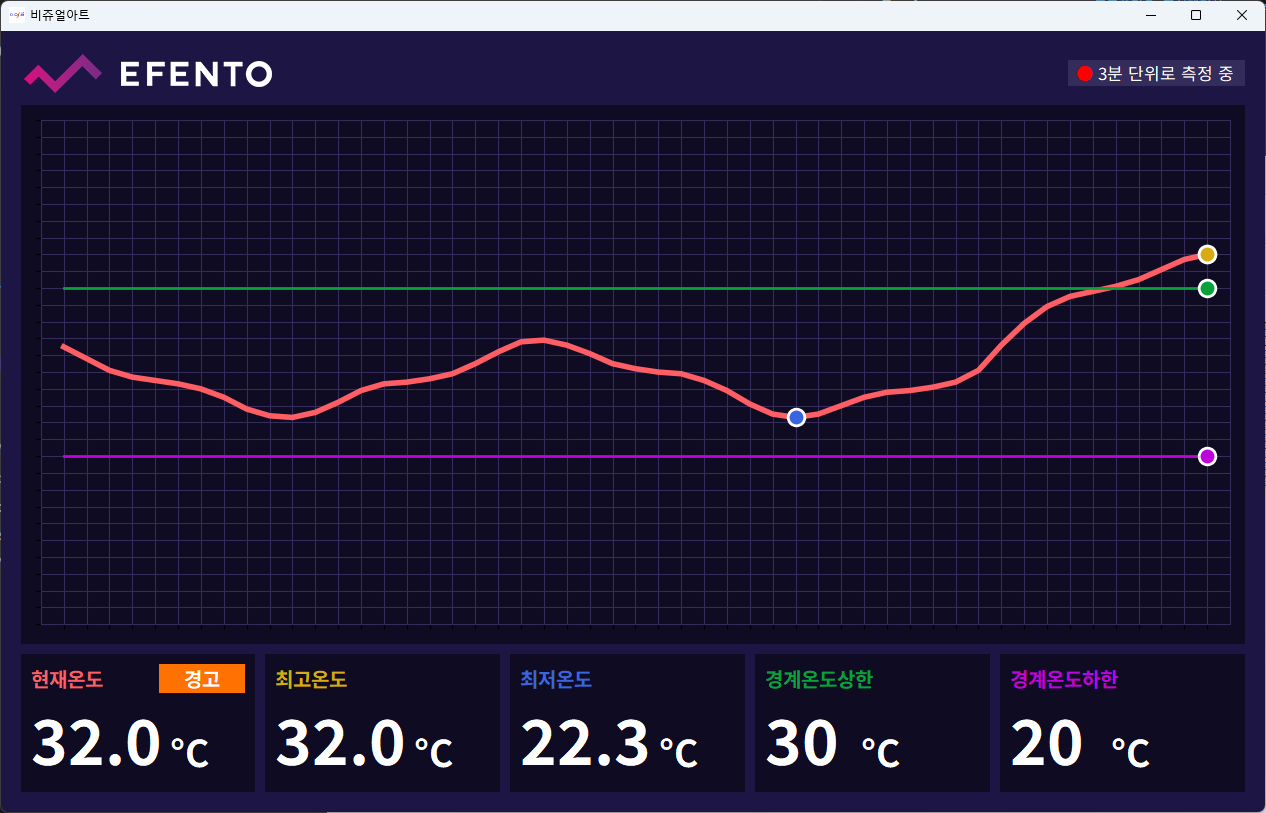
When the current reading leaves the configured range, an alert badge appears on the current-temperature panel and an alert sound repeats until the reading returns to range.
System architecture
Components
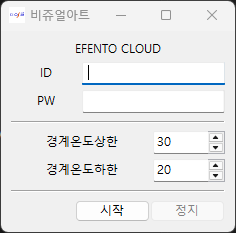
- Login window: opens a cloud session and sets the upper and lower thresholds
- Monitoring window: draws the graph and the numeric panels
- Cloud API module: resolves the company and sensor from the session token and fetches recent measurements
info.ini: company name, sensor serial, display window in minutes, polling interval in minutes
Data flow
- The session token and account email obtained at login are attached to the headers of every subsequent request
- The company name and sensor serial in the config file are resolved to the cloud's company and sensor IDs
- A polling thread requests one display window's worth of measurements on each interval
- The response is converted into
{minutes since the latest measurement: temperature}, gaps are filled, and the graph and panels are redrawn
Polling, screen updates, and alert playback each run on their own thread, so an active alert never stalls polling or redrawing.
Result
Left running on a monitor at the site, the program shows the current temperature and whether it has left the safe range without anyone opening the cloud's web interface. Because a breach announces itself on screen and through sound, the display does not have to be watched.
Thresholds can be changed from within the program, and the sensor being watched, the display window, and the polling interval are all changed by editing the config file — the same executable carries over to another sensor or another site.
Technology
- Python
- wxPython
- matplotlib
- REST API
- PyInstaller
Screens
Have a problem that needs solving?
From software development to equipment integration and engineering, we can work out the approach that fits what your project needs.
Discuss a project